Distribución del pago de impuestos y recepción del gasto público
Distribución del pago de impuestos y recepción del gasto público
Distribución del pago de impuestos y recepción del gasto público

You also want an ePaper? Increase the reach of your titles
YUMPU automatically turns print PDFs into web optimized ePapers that Google loves.
Hogares<br />
Población<br />
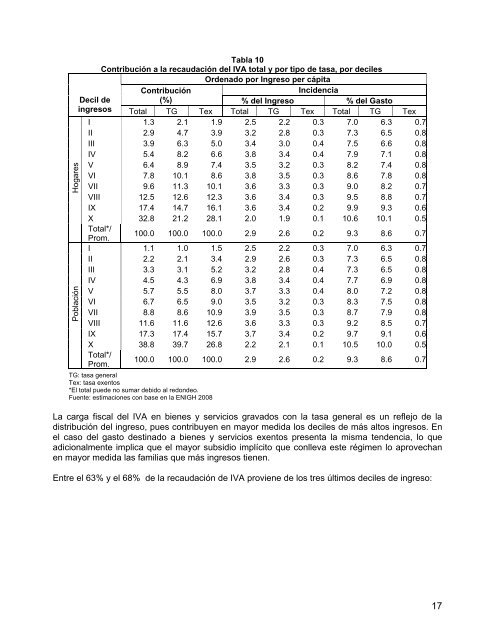
Tabla 10<br />
Contribución a la recaudación <strong><strong>de</strong>l</strong> IVA total y por tipo <strong>de</strong> tasa, por <strong>de</strong>ciles<br />
Or<strong>de</strong>nado por Ingreso per cápita<br />
Contribución<br />
Inci<strong>de</strong>ncia<br />
Decil <strong>de</strong><br />
(%) % <strong><strong>de</strong>l</strong> Ingreso % <strong><strong>de</strong>l</strong> Gasto<br />
ingresos Total TG Tex Total TG Tex Total TG Tex<br />
I 1.3 2.1 1.9 2.5 2.2 0.3 7.0 6.3 0.7<br />
II 2.9 4.7 3.9 3.2 2.8 0.3 7.3 6.5 0.8<br />
III 3.9 6.3 5.0 3.4 3.0 0.4 7.5 6.6 0.8<br />
IV 5.4 8.2 6.6 3.8 3.4 0.4 7.9 7.1 0.8<br />
V 6.4 8.9 7.4 3.5 3.2 0.3 8.2 7.4 0.8<br />
VI 7.8 10.1 8.6 3.8 3.5 0.3 8.6 7.8 0.8<br />
VII 9.6 11.3 10.1 3.6 3.3 0.3 9.0 8.2 0.7<br />
VIII 12.5 12.6 12.3 3.6 3.4 0.3 9.5 8.8 0.7<br />
IX 17.4 14.7 16.1 3.6 3.4 0.2 9.9 9.3 0.6<br />
X 32.8 21.2 28.1 2.0 1.9 0.1 10.6 10.1 0.5<br />
Total*/<br />
Prom.<br />
100.0 100.0 100.0 2.9 2.6 0.2 9.3 8.6 0.7<br />
I 1.1 1.0 1.5 2.5 2.2 0.3 7.0 6.3 0.7<br />
II 2.2 2.1 3.4 2.9 2.6 0.3 7.3 6.5 0.8<br />
III 3.3 3.1 5.2 3.2 2.8 0.4 7.3 6.5 0.8<br />
IV 4.5 4.3 6.9 3.8 3.4 0.4 7.7 6.9 0.8<br />
V 5.7 5.5 8.0 3.7 3.3 0.4 8.0 7.2 0.8<br />
VI 6.7 6.5 9.0 3.5 3.2 0.3 8.3 7.5 0.8<br />
VII 8.8 8.6 10.9 3.9 3.5 0.3 8.7 7.9 0.8<br />
VIII 11.6 11.6 12.6 3.6 3.3 0.3 9.2 8.5 0.7<br />
IX 17.3 17.4 15.7 3.7 3.4 0.2 9.7 9.1 0.6<br />
X 38.8 39.7 26.8 2.2 2.1 0.1 10.5 10.0 0.5<br />
Total*/<br />
Prom.<br />
100.0 100.0 100.0 2.9 2.6 0.2 9.3 8.6 0.7<br />
TG: tasa general<br />
Tex: tasa exentos<br />
*El total pue<strong>de</strong> no sumar <strong>de</strong>bido al redon<strong>de</strong>o.<br />
Fuente: estimaciones con base en la ENIGH 2008<br />
La carga fiscal <strong><strong>de</strong>l</strong> IVA en bienes y servicios gravados con la tasa general es un reflejo <strong>de</strong> la<br />
distribución <strong><strong>de</strong>l</strong> ingreso, pues contribuyen en mayor medida los <strong>de</strong>ciles <strong>de</strong> más altos ingresos. En<br />
el caso <strong><strong>de</strong>l</strong> <strong>gasto</strong> <strong>de</strong>stinado a bienes y servicios exentos presenta la misma ten<strong>de</strong>ncia, lo que<br />
adicionalmente implica que el mayor subsidio implícito que conlleva este régimen lo aprovechan<br />
en mayor medida las familias que más ingresos tienen.<br />
Entre el 63% y el 68% <strong>de</strong> la recaudación <strong>de</strong> IVA proviene <strong>de</strong> los tres últimos <strong>de</strong>ciles <strong>de</strong> ingreso:<br />
17