Rapport mondial sur les drogues 2005 - United Nations Office on ...
Rapport mondial sur les drogues 2005 - United Nations Office on ...
Rapport mondial sur les drogues 2005 - United Nations Office on ...

You also want an ePaper? Increase the reach of your titles
YUMPU automatically turns print PDFs into web optimized ePapers that Google loves.
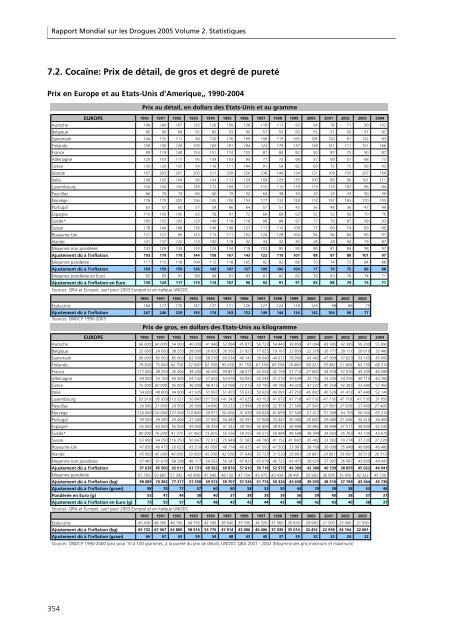
<str<strong>on</strong>g>Rapport</str<strong>on</strong>g> M<strong>on</strong>dial <str<strong>on</strong>g>sur</str<strong>on</strong>g> <str<strong>on</strong>g>les</str<strong>on</strong>g> Drogues <str<strong>on</strong>g>2005</str<strong>on</strong>g> Volume 2. Statistiques7.2. Cocaïne: Prix de détail, de gros et degré de puretéPrix en Europe et au Etats-Unis d’Amerique,, 1990-2004EUROPE 1990 1991 1992 1993 1994 1995 1996 1997 1998 1999 2000 2001 2002 2003 2004Autriche 198 180 167 120 126 156 138 118 113 93 94 78 71 90 102Belgique 80 90 68 95 82 93 90 57 55 60 55 51 50 51 87Danemark 144 135 111 90 150 176 169 108 119 165 106 120 91 122 83Finlande 159 150 126 105 165 191 184 123 179 157 138 121 111 151 166France 99 119 140 153 151 174 125 87 84 82 50 87 75 90 87Allemagne 120 103 111 95 109 103 90 77 72 68 57 58 57 68 73Grèce 150 120 105 54 116 111 144 91 54 82 69 72 75 96 93Islande 167 203 207 200 211 228 226 238 149 134 121 109 150 207 156Italie 108 120 164 90 104 113 129 109 129 135 100 89 90 101 111Luxembourg 150 150 150 150 172 194 127 115 110 119 119 119 107 96 84Pays-Bas 66 70 74 66 60 79 52 64 38 33 33 33 33 50 50Norvège 176 170 255 156 145 150 153 177 133 128 114 157 165 170 155Portugal 63 57 60 57 59 66 64 57 51 43 56 48 36 47 49Espagne 110 100 100 63 78 91 72 68 68 63 52 52 56 70 76Suède* 160 152 183 123 148 118 118 98 88 97 77 79 87 99 93Suisse 178 144 188 136 146 148 127 117 110 109 77 69 74 89 89Royaume-Uni 131 127 69 123 113 111 102 124 128 104 94 94 84 90 97Irlande 141 137 120 110 100 119 32 34 32 30 28 28 94 79 87Moyenne n<strong>on</strong> p<strong>on</strong>dérée 133 129 133 110 124 134 119 103 95 95 80 81 84 98 97Ajustement dû à l'inflati<strong>on</strong> 193 179 179 144 158 167 143 122 110 107 88 87 88 101 97Moyenne p<strong>on</strong>dérée 117 115 118 104 112 118 105 92 92 88 70 74 72 84 88Ajustement dû à l'inflati<strong>on</strong> 169 159 159 136 143 147 127 109 106 100 77 79 75 86 88Moyenne p<strong>on</strong>dérée en Euro 92 93 91 89 94 91 83 81 82 82 76 83 76 74 71Ajustement dû à l'inflati<strong>on</strong> en Euro 130 124 117 110 114 107 96 92 91 91 83 88 79 75 71Sources: QRA et Europol, sauf pour 2003 Europol et en italique UNODCPrix au détail, en dollars des Etats-Unis et au gramme1990 1991 1992 1993 1994 1995 1996 1997 1998 1999 2000 2001 2002 2003Etats-Unis 184 177 170 147 137 131 126 127 124 118 129 98 86 75Ajustement dû à l'inflati<strong>on</strong> 267 246 229 193 174 163 152 149 144 134 142 104 90 77Sources: ONDCP 1990-2003Prix de gros, en dollars des Etats-Unis au kilogrammeEUROPE 1990 1991 1992 1993 1994 1995 1996 1997 1998 1999 2000 2001 2002 2003 2004Autriche 66 000 60 000 54 000 40 000 41 946 52 084 45 875 56 723 54 440 38 859 47 094 43 995 42 385 59 300 55 890Belgique 25 000 24 000 38 250 28 000 26 920 30 560 21 927 17 025 19 167 23 859 22 376 26 771 28 111 29 610 32 480Danemark 80 000 85 000 85 000 82 500 58 516 60 034 46 141 38 640 44 517 78 900 43 462 47 839 37 823 53 160 45 900Finlande 79 500 75 000 62 750 52 500 82 500 95 450 91 750 61 550 89 350 78 460 68 321 59 492 51 804 62 150 68 310France 117 000 38 250 45 000 38 250 40 000 39 877 48 077 43 554 42 159 27 714 27 000 34 978 37 676 45 200 46 580Allemagne 69 000 53 100 60 300 54 142 57 692 54 676 53 925 45 294 41 210 39 639 33 752 33 235 34 476 40 110 44 760Grèce 75 000 60 000 95 000 36 000 46 413 53 098 72 015 43 795 49 180 49 320 41 237 40 359 42 385 53 680 57 450Italie 54 000 48 000 94 000 41 935 51 097 51 455 55 633 50 629 49 091 47 250 46 000 40 529 41 412 47 440 52 140Luxembourg 93 919 95 939 113 521 50 847 157 593 141 343 47 625 43 103 41 072 47 718 47 718 47 718 47 718 47 718 31 050Pays-Bas 26 500 27 000 29 500 26 500 24 680 33 232 23 894 29 698 22 355 27 500 27 500 27 500 27 500 27 400 27 400Norvège 120 000 120 000 127 500 110 000 39 971 50 000 41 670 60 028 81 699 57 545 51 417 51 569 54 159 56 500 65 210Portugal 39 500 39 285 33 000 27 000 27 950 34 483 42 591 37 908 33 447 30 000 28 000 29 080 31 046 32 410 36 400Espagne 65 000 60 000 55 000 35 000 36 434 41 322 38 760 36 806 38 924 38 898 30 882 38 898 31 511 38 830 42 540Suède* 80 000 76 200 91 375 61 450 73 825 55 556 59 255 45 573 50 484 48 508 38 394 34 693 35 763 43 130 43 670Suisse 63 900 94 250 116 250 50 847 72 012 75 949 51 587 40 780 41 152 41 000 35 482 23 392 19 274 37 230 37 230Royaume-Uni 47 850 46 475 20 625 43 210 45 000 46 774 40 625 47 500 47 500 33 981 38 168 36 008 35 848 40 880 46 480Irlande 45 000 45 000 40 000 50 000 45 000 42 000 31 646 33 733 31 530 29 891 29 891 29 891 29 891 30 510 30 510Moyenne n<strong>on</strong> p<strong>on</strong>dérée 67 481 61 618 68 298 48 717 54 562 56 347 47 823 43 079 45 722 43 473 38 629 37 997 36 987 43 839 44 941Ajustement dû à l'inflati<strong>on</strong> 97 636 85 560 92 011 63 731 69 562 69 870 57 610 50 718 52 975 49 309 42 380 40 539 38 859 45 022 44 941Moyenne p<strong>on</strong>dérée 67 793 50 687 57 392 43 998 47 040 48 150 47 754 43 975 43 434 38 491 35 580 36 095 35 950 42 322 45 730Ajustement dû à l'inflati<strong>on</strong> (kg) 98 089 70 382 77 317 57 558 59 972 59 707 57 526 51 774 50 324 43 658 39 035 38 510 37 769 43 464 45 730Ajustement dû à l'inflati<strong>on</strong> (gram) 98 70 77 57 60 60 58 52 50 44 39 38 38 43 46P<strong>on</strong>dérée en Euro (g) 53 41 44 38 40 37 38 39 39 36 39 40 38 37 37Ajustement dû à l'inflati<strong>on</strong> en Euro (g) 75 55 57 47 48 43 43 44 43 40 42 43 40 38 37Sources: QRA et Europol, sauf pour 2003 Europol et en italique UNODC1990 1991 1992 1993 1994 1995 1996 1997 1998 1999 2000 2001 2002 2003Etats-Unis 45 430 48 300 48 100 44 730 42 180 38 640 35 700 34 320 31 960 30 870 29 580 21 500 23 000 21 500Ajustement dû à l'inflati<strong>on</strong> (kg) 65 732 67 067 64 800 58 516 53 776 47 914 43 006 40 406 37 030 35 014 32 452 22 938 24 164 22 081Ajustement dû à l'inflati<strong>on</strong> (gram) 66 67 65 59 54 48 43 40 37 35 32 23 24 22Sources: ONDCP 1990-2000 (prix pour 10 à 100 grammes, à la pureté du prix de détail), UNODC QRA 2001 - 2002 (Moyenne des prix minimum et maximum)354