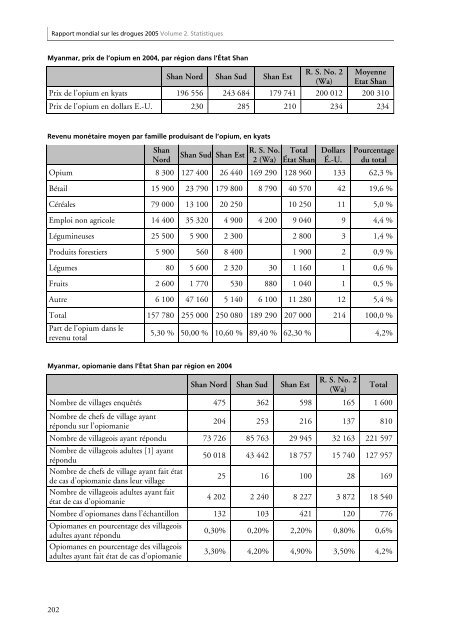
<str<strong>on</strong>g>Rapport</str<strong>on</strong>g> <str<strong>on</strong>g>m<strong>on</strong>dial</str<strong>on</strong>g> <str<strong>on</strong>g>sur</str<strong>on</strong>g> <str<strong>on</strong>g>les</str<strong>on</strong>g> <str<strong>on</strong>g>drogues</str<strong>on</strong>g> <str<strong>on</strong>g>2005</str<strong>on</strong>g> Volume 2. StatistiquesMyanmar, prix de l’opium en 2004, par régi<strong>on</strong> dans l’État ShanShan Nord Shan Sud Shan EstR. S. No. 2(Wa)MoyenneEtat ShanPrix de l’opium en kyats 196 556 243 684 179 741 200 012 200 310Prix de l’opium en dollars E.-U. 230 285 210 234 234Revenu m<strong>on</strong>étaire moyen par famille produisant de l’opium, en kyatsShanNordShan Sud Shan EstR. S. No.2 (Wa)TotalÉtat ShanDollarsÉ.-U.Pourcentagedu totalOpium 8 300 127 400 26 440 169 290 128 960 133 62,3 %Bétail 15 900 23 790 179 800 8 790 40 570 42 19,6 %Céréa<str<strong>on</strong>g>les</str<strong>on</strong>g> 79 000 13 100 20 250 10 250 11 5,0 %Emploi n<strong>on</strong> agricole 14 400 35 320 4 900 4 200 9 040 9 4,4 %Légumineuses 25 500 5 900 2 300 2 800 3 1,4 %Produits forestiers 5 900 560 8 400 1 900 2 0,9 %Légumes 80 5 600 2 320 30 1 160 1 0,6 %Fruits 2 600 1 770 530 880 1 040 1 0,5 %Autre 6 100 47 160 5 140 6 100 11 280 12 5,4 %Total 157 780 255 000 250 080 189 290 207 000 214 100,0 %Part de l’opium dans lerevenu total5,30 % 50,00 % 10,60 % 89,40 % 62,30 % 4,2%Myanmar, opiomanie dans l’État Shan par régi<strong>on</strong> en 2004Shan Nord Shan Sud Shan EstR. S. No. 2(Wa)TotalNombre de villages enquêtés 475 362 598 165 1 600Nombre de chefs de village ayantrép<strong>on</strong>du <str<strong>on</strong>g>sur</str<strong>on</strong>g> l’opiomanie204 253 216 137 810Nombre de villageois ayant rép<strong>on</strong>du 73 726 85 763 29 945 32 163 221 597Nombre de villageois adultes [1] ayantrép<strong>on</strong>duNombre de chefs de village ayant fait étatde cas d’opiomanie dans leur villageNombre de villageois adultes ayant faitétat de cas d’opiomanie50 018 43 442 18 757 15 740 127 95725 16 100 28 1694 202 2 240 8 227 3 872 18 540Nombre d’opiomanes dans l’échantill<strong>on</strong> 132 103 421 120 776Opiomanes en pourcentage des villageoisadultes ayant rép<strong>on</strong>duOpiomanes en pourcentage des villageoisadultes ayant fait état de cas d’opiomanie0,30% 0,20% 2,20% 0,80% 0,6%3,30% 4,20% 4,90% 3,50% 4,2%202
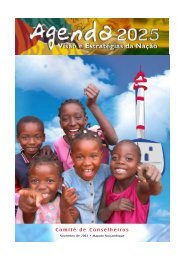
5.1. Producti<strong>on</strong> : Opium/HéroïneMyanmar, État Shan – Répartiti<strong>on</strong> démographique des opiomanes par sexe et par âge en 2004ÂgeHommes Femmes Total Pourcentage du total0-10 3 3 6 0,81 %10-20 5 5 0,68 %20-30 28 7 35 4,73 %30-40 84 14 98 13,24 %40-50 137 16 153 20,68 %50-60 162 27 189 25,54 %60-70 140 16 156 21,08 %70-80 63 6 69 9,32 %80-90 23 5 28 3,78 %90-100 1 1 0,14 %646 94 740Myanmar, État Shan – Répartiti<strong>on</strong> démographique des opiomanes par âge en 2004Fréquence relative, par âge, del'opiomanie30%25%20%15%10%5%0%0-10 10-20 20-30 30-40 40-50 50-60 60-70 70-80 80-90 90-100âgeMyanmar, superficies éradiquées déclarées, par régi<strong>on</strong> et par état en 2004Unité administrative2003 (ha) 2004 (ha) Variati<strong>on</strong> (%)Shan Nord 235 172 -27%Shan Sud 182 2,170 1092%Shan Est 91 195 114%R.S.No 2 (Wa) 55 0 -État Shan 563 2,537 351%État Kachin 56 126 125%État Chin 2 0 -100%Sagaing 0 74 -État Kayah 9 83 824%Divisi<strong>on</strong> de Mandalay 8 0 -Total 638 2,820 342%203
- Page 1: 2005RAPPORT MONDIA
- Page 4 and 5: L'Office pour le c
- Page 6 and 7: Table des matièresVolume 1. Analys
- Page 9: 5. PRODUCTION
- Page 13 and 14: 5.1. Production : Opium/Héroïne5.
- Page 15 and 16: 5.1. Production : Opium/HéroïneFi
- Page 17 and 18: 5.1. Production : Opium/HéroïneAf
- Page 19 and 20: 5.1. Production : Opium/HéroïneAf
- Page 21 and 22: 5.1. Production : Opium/HéroïneAf
- Page 23 and 24: 5.1. Production : Opium/Héroïne70
- Page 25 and 26: 5.1. Production : Opium/HéroïneFi
- Page 27: 5.1. Production : Opium/HéroïneMy
- Page 31 and 32: 5.1. Production : Opium/Héroïne5.
- Page 33 and 34: 5.1. Production : Opium/HéroïneGr
- Page 35 and 36: 5.1. Production : Opium/HéroïneRD
- Page 37: 5.1. Production : Opium/HéroïneR
- Page 40 and 41: Rapport mo
- Page 42 and 43: Rapport mo
- Page 44 and 45: Rapport mo
- Page 46 and 47: Rapport mo
- Page 48 and 49: Rapport mo
- Page 50 and 51: Rapport mo
- Page 52 and 53: Rapport mo
- Page 54 and 55: Rapport mo
- Page 56 and 57: Rapport mo
- Page 58 and 59: Rapport mo
- Page 60 and 61: Rapport mo
- Page 62 and 63: Rapport mo
- Page 64 and 65: Rapport mo
- Page 67 and 68: 5.1. Production: Cannabis5.3. Canna
- Page 69 and 70: 5.1. Production: CannabisGraphiques
- Page 71 and 72: 5.1. Production: CannabisMaroc - Pr
- Page 73 and 74: 5.1. Production: Cannabis5.4. Stimu
- Page 75 and 76: 5.1. Production: CannabisRégion So
- Page 77 and 78: 5.1. Production: Autres dro
- Page 79 and 80:
5.1. Production: Autres dro
- Page 81 and 82:
Rapport Mondial <s
- Page 83 and 84:
Rapport Mondial <s
- Page 85 and 86:
Rapport Mondial <s
- Page 87 and 88:
Rapport Mondial <s
- Page 89 and 90:
Rapport Mondial <s
- Page 91 and 92:
Rapport Mondial <s
- Page 93 and 94:
Rapport Mondial <s
- Page 95 and 96:
Rapport Mondial <s
- Page 97 and 98:
Rapport Mondial <s
- Page 99 and 100:
Rapport Mondial <s
- Page 101 and 102:
Rapport Mondial <s
- Page 103 and 104:
Rapport Mondial <s
- Page 105 and 106:
Rapport Mondial <s
- Page 107 and 108:
Rapport Mondial <s
- Page 109 and 110:
Rapport Mondial <s
- Page 111 and 112:
Rapport Mondial <s
- Page 113 and 114:
Rapport Mondial <s
- Page 115 and 116:
Rapport Mondial <s
- Page 117 and 118:
Rapport Mondial <s
- Page 119 and 120:
Rapport Mondial <s
- Page 121 and 122:
Rapport Mondial <s
- Page 123 and 124:
Rapport Mondial <s
- Page 125 and 126:
Rapport Mondial <s
- Page 127 and 128:
Rapport Mondial <s
- Page 129 and 130:
Rapport Mondial <s
- Page 131 and 132:
Rapport Mondial <s
- Page 133 and 134:
Rapport Mondial <s
- Page 135 and 136:
Rapport Mondial <s
- Page 137 and 138:
Rapport Mondial <s
- Page 139 and 140:
Rapport Mondial <s
- Page 141 and 142:
Rapport Mondial <s
- Page 143 and 144:
Rapport Mondial <s
- Page 145 and 146:
Rapport Mondial <s
- Page 147 and 148:
Rapport Mondial <s
- Page 149 and 150:
Rapport Mondial <s
- Page 151 and 152:
Rapport Mondial <s
- Page 153 and 154:
Rapport Mondial <s
- Page 155 and 156:
Rapport Mondial <s
- Page 157 and 158:
Rapport Mondial <s
- Page 159 and 160:
Rapport Mondial <s
- Page 161 and 162:
Rapport Mondial <s
- Page 163 and 164:
Rapport Mondial <s
- Page 165 and 166:
Rapport Mondial <s
- Page 167 and 168:
Rapport Mondial <s
- Page 169 and 170:
Rapport Mondial <s
- Page 172 and 173:
7.Prix7.1. Opiacés: Prix de détai
- Page 174 and 175:
7.PrixHEROÏNEPrix de détail, de g
- Page 176 and 177:
7.PrixHEROÏNEPrix de détail, de g
- Page 178 and 179:
7.PrixCOCAÏNEPrix de détail, de g
- Page 180 and 181:
7.PrixCOCAÏNEPrix de détail, de g
- Page 182 and 183:
7.PrixFEUILLE DE CANNABISPrix de d
- Page 184 and 185:
7.PrixRÉSINE DE CANNABISPrix de d
- Page 186 and 187:
7.Prix7.4. Stimulants de type amph
- Page 188 and 189:
7.PrixL.S.DPrix de détail, de gros
- Page 190 and 191:
7.PrixPRIX DE DETAIL (au comprimé)
- Page 192:
8. CONSOMMATION
- Page 195 and 196:
Rapport Mondial <s
- Page 197 and 198:
Rapport Mondial <s
- Page 199 and 200:
Rapport Mondial <s
- Page 201 and 202:
Rapport Mondial <s
- Page 203 and 204:
Rapport Mondial <s
- Page 205 and 206:
Rapport Mondial <s
- Page 207 and 208:
Rapport Mondial <s
- Page 209 and 210:
Rapport mo
- Page 211 and 212:
Rapport mo
- Page 213 and 214:
Rapport mo
- Page 215 and 216:
Rapport mo
- Page 217 and 218:
Rapport mo
- Page 219 and 220:
Rapport mo
- Page 221 and 222:
Rapport mo
- Page 223 and 224:
Rapport mo
- Page 225 and 226:
Rapport mo
- Page 227 and 228:
Rapport mo
- Page 229 and 230:
Rapport mo
- Page 232 and 233:
Printed in SlovakiaDecember <strong