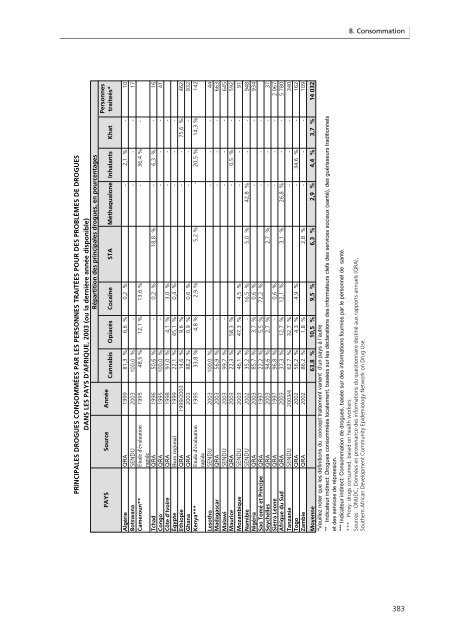
8. C<strong>on</strong>sommati<strong>on</strong>Répartiti<strong>on</strong> des principa<str<strong>on</strong>g>les</str<strong>on</strong>g> <str<strong>on</strong>g>drogues</str<strong>on</strong>g>, en pourcentagesDANS LES PAYS D'AFRIQUE, 2003 (ou la dernière année disp<strong>on</strong>ible)PRINCIPALES DROGUES CONSOMMÉES PAR LES PERSONNES TRAITÉES POUR DES PROBLÈMES DE DROGUESPAYS Source AnnéeCannabis Opiacés Cocaïne STA Méthaqual<strong>on</strong>e Inhalants KhatPers<strong>on</strong>nestraiteés*Algérie QRA 1999 81,3 % 6,6 % 0,2 % - 2,1 % - 10Botswana SENDU 2003 100,0 % - - - - 17Cameroun** Etude d'évaluati<strong>on</strong> 1995 48,5 % 12,1 % 13,6 % - 36,4 % -rapideTchad QRA 1996 50,6 % - 0,2 % 18,8 % - 6,3 % - 16C<strong>on</strong>go QRA 1995 100,0 % - - - - 41Côte d'Ivoire QRA 1998 91,0 % 4,1 % 3,0 % - - -Égypte Buro regi<strong>on</strong>al 1999 22,1 % 45,1 % 0,4 % - - -Ethiopie QRA 1999/2003 14,6 % 9,6 % - - 75,6 % 462Ghana QRA 2003 88,2 % 0,9 % 0,6 % - - - 932Kenya*** Etude d'évaluati<strong>on</strong> 1995 33,8 % 4,8 % 2,9 % 5,2 % - 20,5 % 14,3 % 142rapideLesotho SENDU 2003 100,0 % - - - - 44Madagascar QRA 2003 56,9 % - - - - 663Malawi SENDU 2003 99,7 % - - - - 645Maurice QRA 2003 22,3 % 58,3 % - 0,5 % - 592Mozambique SENDU 2003 46,1 % 47,3 % 4,5 % - - - 91Namibie SENDU 2002 35,2 % - 16,5 % 5,0 % 42,8 % - - 948Nigéria QRA 2003 85,7 % 3,7 % 0,6 % - - 934Sao Tomé et Principe QRA 1997 22,2 % 5,5 % 72,2 % - - -Seychel<str<strong>on</strong>g>les</str<strong>on</strong>g> QRA 2003 94,6 % 2,7 % 2,7 % - - - 37Sierra Le<strong>on</strong>e QRA 1997 96,8 % - 0,6 % - - - 2 067Afrique du Sud QRA 2003 37,3 % 12,7 % 12,1 % 3,1 % 26,8 % - - 5 780Tanzanie SENDU 2003/4 62,7 % 32,7 % - - - 340Togo QRA 2002 56,2 % 4,3 % 4,9 % - 34,6 % - 162Zambie QRA 2002 86,2 % 1,8 % 2,8 % - - - 109Moyenne 63,8 % 10,5 % 9,5 % 6,3 % 2,9 % 4,4 % 3,7 % 14 032*Veuillez noter que <str<strong>on</strong>g>les</str<strong>on</strong>g> définiti<strong>on</strong>s du c<strong>on</strong>cept traitement varient d’un pays á l’autre** Indicateur indirect: Drogues c<strong>on</strong>sommées localement, basées <str<strong>on</strong>g>sur</str<strong>on</strong>g> <str<strong>on</strong>g>les</str<strong>on</strong>g> déclarati<strong>on</strong>s des informateurs clefs des services sociaux (santé), des guérisseurs traditi<strong>on</strong>nelset des services de répressi<strong>on</strong>.*** Indicateur indirect: C<strong>on</strong>sommati<strong>on</strong> de <str<strong>on</strong>g>drogues</str<strong>on</strong>g>, basée <str<strong>on</strong>g>sur</str<strong>on</strong>g> des informati<strong>on</strong>s fournies par le pers<strong>on</strong>nel de santé.*** Proxy: drugs c<strong>on</strong>sumed, based <strong>on</strong> health workers.Sources: ONUDC, D<strong>on</strong>nées en provenance des informati<strong>on</strong>s du questi<strong>on</strong>naire destiné aux rapports annuels (QRA),Southern African Development Community Epidemiology Network <strong>on</strong> Drug Use.383
<str<strong>on</strong>g>Rapport</str<strong>on</strong>g> M<strong>on</strong>dial <str<strong>on</strong>g>sur</str<strong>on</strong>g> <str<strong>on</strong>g>les</str<strong>on</strong>g> Drogues <str<strong>on</strong>g>2005</str<strong>on</strong>g> Volume 2. StatistiquesPRINCIPALES DROGUES CONSOMMÉES PAR LES PERSONNES TRAITÉES POUR DES PROBLÈMES DE DROGUES DANS LES AMÉRIQUES2003 (ou la dernière année disp<strong>on</strong>ible)Type cocaïnePays Source Année (cocaïne, basuco & Cocaïne Basuco Crack Cannabis Inhalants Tranquillisants Opiacés Pers<strong>on</strong>nescrack) Amphétamines Ecstasytraiteés*Argentine QRA 2004 32,6% 24,8% 7,3% 0,2% 31,9% 1,8% 0,4% 15,3% 15,2% 0,6% 144 120Bahamas QRA 2003 36,7% 46,4% 536Barbade SIDUC 1998 72,3% 5,6% 66,7% 27,8% n.a.Bolivie SIDUC/QRA 1998/2003** 54,8% 23,1% 31,8% 14,7% 1,4% 23,5% 5 491Brésil SIDUC 1998 59,2% 14,4% 44,8% 27,2% 2,0% 2,4% 0,4% n.a.Canada CCENDU 2001 25,6% 24,7% 0,4% 21,2% 8,1% 29 214Chili SIDUC/QRA 1998/2003** 89% 21,2% 67,8% 4,1% 4,1% 18 300Colombie SIDUC 1998 56,3% 28,1% 28,2% 13,4% 3,6% 4,8% n.a.Costa Rica QRA 2002/03** 54,3% 23,8% 30,5% 30,1% 12 500Écuateur SIDUC 1998/2003** 66,1% 13,5% 52,5% 10,2% 4,6% 5 250El Salvador QRA 1998/2002** 100,0% 6 000États-Unis SAMHSA/DAWN 2003 30,9% 8,4% 22,5% 54,1% 19,1% 0,6% 7,5% 5,9% 15,6% 1 802 000Grenade QRA 2001 75,0% 58,3% 12Guatemala QRA 2003 75,0% 25,0% 2 000Haïti QRA 2002 37,5% 35,4% 6,3% 2,1% 51H<strong>on</strong>duras SIDUC 1998 9,0% 3,1% 5,9% 34,4% 9,0% n.a.Jamaïque SIDUC/QRA 1998/2001** 58% 58% 28,9% 1 362Mexique QRA 2003 62,6% 56,6% 13,7% 28,8% 14,6% 4,9% 9 621Nicaragua SIDUC 1998 77,3% 14,5% 62,8% 7,3% 12,7% n.a.Panama SIDUC/QRA 1998/2001** 49,4% 48,9% 0,5% 5,1% 0,5% 5 838Pérou SIDUC/QRA 1998/99** 90,8% 20,4% 70,4% 5,6% 4 000Rép. Dominicaine QRA 2001/03** 76,4% 20,0% 3,6% 2 728St.Vincent et <str<strong>on</strong>g>les</str<strong>on</strong>g> Grenadines QRA 2001 13,4% 86,6% 134Trinité et Tobago QRA 2001 35,9% 17,6% 501Uruguay SIDUC 1998 46,4% 46,4% 12,2% 0,6% 9,2% n.a.Venezuela QRA 2003 76,9% 12,5% 0,1% 0,2% 0,3% 0,7% 2,0% 7 321Moyenne n<strong>on</strong>-p<strong>on</strong>dérée 56,2% 27,6% 5,0% 0,4% 9,9% 9,5% 1,4% 2 056 979Amérique du Nord - Moyenne n<strong>on</strong>-p<strong>on</strong>dérée 39,7% 45,1% 11,1% 0,6% 18,2% 13,9% 9,5% 1 840 835Amérique du sud - Moyenne n<strong>on</strong>-p<strong>on</strong>dérée 58,4% 24,1% 0,5% 0,0% 3,6% 1,1% 0,4% 216 144Note: Les <str<strong>on</strong>g>drogues</str<strong>on</strong>g> s<strong>on</strong>t <str<strong>on</strong>g>les</str<strong>on</strong>g> plus communément c<strong>on</strong>sommées dans <str<strong>on</strong>g>les</str<strong>on</strong>g> diférents pays, de sorte que le total peut ne pas corresp<strong>on</strong>dre à 100% pour tous <str<strong>on</strong>g>les</str<strong>on</strong>g> pays.*Veuillez noter que <str<strong>on</strong>g>les</str<strong>on</strong>g> définiti<strong>on</strong>s du c<strong>on</strong>cept traitement varient d’un pays á l’autre**La sec<strong>on</strong>de année est spécifiée pour le nombre de pers<strong>on</strong>nes traitées (dernière col<strong>on</strong>ne)Sources: SIDUC, Treatment Centres Data 1998, Drug of impact; SIDUC 1997 Report; Treatment episode dataset TEDS, États-Unis 1992-2002;Secretaria Naci<strong>on</strong>al Antidrogas, Brésil (<str<strong>on</strong>g>les</str<strong>on</strong>g> d<strong>on</strong>nées c<strong>on</strong>cernent un centre de traitement de l'État de Minas Gerais (985 cas); Réseau Communautaire Canadien d'épidémiologie des Toxicomanies (RCCET),Statistiques de morbidité 2000/2001 (départs du centre de traitement liées à la l'utilisati<strong>on</strong> des <str<strong>on</strong>g>drogues</str<strong>on</strong>g> illicites).STA384
- Page 1:
2005RAPPORT MONDIA
- Page 4 and 5:
L'Office pour le c
- Page 6 and 7:
Table des matièresVolume 1. Analys
- Page 9:
5. PRODUCTION
- Page 13 and 14:
5.1. Production : Opium/Héroïne5.
- Page 15 and 16:
5.1. Production : Opium/HéroïneFi
- Page 17 and 18:
5.1. Production : Opium/HéroïneAf
- Page 19 and 20:
5.1. Production : Opium/HéroïneAf
- Page 21 and 22:
5.1. Production : Opium/HéroïneAf
- Page 23 and 24:
5.1. Production : Opium/Héroïne70
- Page 25 and 26:
5.1. Production : Opium/HéroïneFi
- Page 27 and 28:
5.1. Production : Opium/HéroïneMy
- Page 29 and 30:
5.1. Production : Opium/HéroïneMy
- Page 31 and 32:
5.1. Production : Opium/Héroïne5.
- Page 33 and 34:
5.1. Production : Opium/HéroïneGr
- Page 35 and 36:
5.1. Production : Opium/HéroïneRD
- Page 37:
5.1. Production : Opium/HéroïneR
- Page 40 and 41:
Rapport mo
- Page 42 and 43:
Rapport mo
- Page 44 and 45:
Rapport mo
- Page 46 and 47:
Rapport mo
- Page 48 and 49:
Rapport mo
- Page 50 and 51:
Rapport mo
- Page 52 and 53:
Rapport mo
- Page 54 and 55:
Rapport mo
- Page 56 and 57:
Rapport mo
- Page 58 and 59:
Rapport mo
- Page 60 and 61:
Rapport mo
- Page 62 and 63:
Rapport mo
- Page 64 and 65:
Rapport mo
- Page 67 and 68:
5.1. Production: Cannabis5.3. Canna
- Page 69 and 70:
5.1. Production: CannabisGraphiques
- Page 71 and 72:
5.1. Production: CannabisMaroc - Pr
- Page 73 and 74:
5.1. Production: Cannabis5.4. Stimu
- Page 75 and 76:
5.1. Production: CannabisRégion So
- Page 77 and 78:
5.1. Production: Autres dro
- Page 79 and 80:
5.1. Production: Autres dro
- Page 81 and 82:
Rapport Mondial <s
- Page 83 and 84:
Rapport Mondial <s
- Page 85 and 86:
Rapport Mondial <s
- Page 87 and 88:
Rapport Mondial <s
- Page 89 and 90:
Rapport Mondial <s
- Page 91 and 92:
Rapport Mondial <s
- Page 93 and 94:
Rapport Mondial <s
- Page 95 and 96:
Rapport Mondial <s
- Page 97 and 98:
Rapport Mondial <s
- Page 99 and 100:
Rapport Mondial <s
- Page 101 and 102:
Rapport Mondial <s
- Page 103 and 104:
Rapport Mondial <s
- Page 105 and 106:
Rapport Mondial <s
- Page 107 and 108:
Rapport Mondial <s
- Page 109 and 110:
Rapport Mondial <s
- Page 111 and 112:
Rapport Mondial <s
- Page 113 and 114:
Rapport Mondial <s
- Page 115 and 116:
Rapport Mondial <s
- Page 117 and 118:
Rapport Mondial <s
- Page 119 and 120:
Rapport Mondial <s
- Page 121 and 122:
Rapport Mondial <s
- Page 123 and 124:
Rapport Mondial <s
- Page 125 and 126:
Rapport Mondial <s
- Page 127 and 128:
Rapport Mondial <s
- Page 129 and 130:
Rapport Mondial <s
- Page 131 and 132:
Rapport Mondial <s
- Page 133 and 134:
Rapport Mondial <s
- Page 135 and 136:
Rapport Mondial <s
- Page 137 and 138:
Rapport Mondial <s
- Page 139 and 140:
Rapport Mondial <s
- Page 141 and 142:
Rapport Mondial <s
- Page 143 and 144:
Rapport Mondial <s
- Page 145 and 146:
Rapport Mondial <s
- Page 147 and 148:
Rapport Mondial <s
- Page 149 and 150:
Rapport Mondial <s
- Page 151 and 152:
Rapport Mondial <s
- Page 153 and 154:
Rapport Mondial <s
- Page 155 and 156: Rapport Mondial <s
- Page 157 and 158: Rapport Mondial <s
- Page 159 and 160: Rapport Mondial <s
- Page 161 and 162: Rapport Mondial <s
- Page 163 and 164: Rapport Mondial <s
- Page 165 and 166: Rapport Mondial <s
- Page 167 and 168: Rapport Mondial <s
- Page 169 and 170: Rapport Mondial <s
- Page 172 and 173: 7.Prix7.1. Opiacés: Prix de détai
- Page 174 and 175: 7.PrixHEROÏNEPrix de détail, de g
- Page 176 and 177: 7.PrixHEROÏNEPrix de détail, de g
- Page 178 and 179: 7.PrixCOCAÏNEPrix de détail, de g
- Page 180 and 181: 7.PrixCOCAÏNEPrix de détail, de g
- Page 182 and 183: 7.PrixFEUILLE DE CANNABISPrix de d
- Page 184 and 185: 7.PrixRÉSINE DE CANNABISPrix de d
- Page 186 and 187: 7.Prix7.4. Stimulants de type amph
- Page 188 and 189: 7.PrixL.S.DPrix de détail, de gros
- Page 190 and 191: 7.PrixPRIX DE DETAIL (au comprimé)
- Page 192: 8. CONSOMMATION
- Page 195 and 196: Rapport Mondial <s
- Page 197 and 198: Rapport Mondial <s
- Page 199 and 200: Rapport Mondial <s
- Page 201 and 202: Rapport Mondial <s
- Page 203 and 204: Rapport Mondial <s
- Page 205: Rapport Mondial <s
- Page 209 and 210: Rapport mo
- Page 211 and 212: Rapport mo
- Page 213 and 214: Rapport mo
- Page 215 and 216: Rapport mo
- Page 217 and 218: Rapport mo
- Page 219 and 220: Rapport mo
- Page 221 and 222: Rapport mo
- Page 223 and 224: Rapport mo
- Page 225 and 226: Rapport mo
- Page 227 and 228: Rapport mo
- Page 229 and 230: Rapport mo
- Page 232 and 233: Printed in SlovakiaDecember <strong