8. C<strong>on</strong>sommati<strong>on</strong>8.2. Demande de traitement (Principa<str<strong>on</strong>g>les</str<strong>on</strong>g> <str<strong>on</strong>g>drogues</str<strong>on</strong>g> c<strong>on</strong>somméesPRINCIPALES DROGUES CONSOMMÉES PAR LES PERSONNES TRAITÉES POUR DES PROBLÈMES DE DROGUES DANS LES PAYS DE L'EUROPE OCCIDENTALE, 2003(ou la dernière année disp<strong>on</strong>ible)Répartiti<strong>on</strong> des principa<str<strong>on</strong>g>les</str<strong>on</strong>g> <str<strong>on</strong>g>drogues</str<strong>on</strong>g>, en pourcentagesPays* Source Année Opiacés Cocaïne Amphétamines Ecstasy STAAutresAmphétamines Ecstasy DrugsAllemagne OEDT 2003 66,2% 25,6% 14,9% 13,4% 6,9% 58,0% -Autriche Gouvernement 2003 87,0% - - - - - -BelgiqueOEDT/Pointcentral2002 61,3% 15,0% 5,5% 0,8% 0,4% 14,6% -Danemark OEDT 2002 46,0% 3,0% 5,0% 1,0% 0,0% 27,0% 18,0%Espagne ONUDC 2002 60,7% 25,5% 0,7% 1,0% 0,2% 10,2% 1,8%Finlande OEDT 2002 34,1% 0,2% 34,0% 0,6% 0,2% 25,6% 5,3%France ONUDC 2001 62,1% 7,3% 0,9% 1,4% 0,9% 23,2% 4,2%Gréce ONUDC 2003 88,4% 1,6% 0,0% 0,4% 0,1% 7,8% 1,7%Irlande ONUDC 2002 74,7% 1,8% 0,4% 3,1% 0,2% 17,6% 2,2%Italie ONUDC 2002 79,8% 6,9% 0,2% 1,0% 0,1% 9,0% 3,0%Luxembourg OEDT 2002 80,0% 6,0% 0,0% 0,0% 0,0% 11,0% 3,0%NorvègeOEDT/Pointcentral2001 58,2% - 12,5 % - - 13,9 % 15,4%Pays-Bas ONUDC 2002 56,7% 27,5% 1,9% 0,9% 0,0% 13,1% -PortugalOEDT/Pointcentral2002 67,0% 32,0% 3,0% 2,0% 0,0% 36,0% -Royaume-Uni (Angleterre) ONUDC 2002 75,0% 6,0% 3,0% 1,0% 0,1% 11,0% 3,6%Suéde ONUDC 2002 31,1% 1,2% 38,2% 1,0% 0,0% 17,6% 10,8%Moyenne 64,3% 10,0% 7,5% 1,7% 0,6% 18,5% 5,8%*Certains patients peuvent être traités pour plusieurs <str<strong>on</strong>g>drogues</str<strong>on</strong>g>- Autriche : <str<strong>on</strong>g>les</str<strong>on</strong>g> d<strong>on</strong>nées s<strong>on</strong>t tirées d’un échantill<strong>on</strong> de 849 c<strong>on</strong>sommateurs de drogue a Vienne. En tout, 6413 c<strong>on</strong>sommateurs d’héroïne <strong>on</strong>t reçu en 2003 un traitement de substituti<strong>on</strong> en Autriche.Le nombre de pers<strong>on</strong>nes traitées pour des comportements psychiques déviants liés a l’usage des <str<strong>on</strong>g>drogues</str<strong>on</strong>g> est de 11753.- Belgique: <str<strong>on</strong>g>les</str<strong>on</strong>g> d<strong>on</strong>nées c<strong>on</strong>cernant <str<strong>on</strong>g>les</str<strong>on</strong>g> opiacés, la cocaïne et le cannabis se réfèrent aux centres de traitement dans la communauté française en 2000;<str<strong>on</strong>g>les</str<strong>on</strong>g> d<strong>on</strong>nées c<strong>on</strong>cernant <str<strong>on</strong>g>les</str<strong>on</strong>g> amphétamines et l' "Ecstasy" se réfèrent aux patients externes traités en Belgique en 1999.- Danemark : Les d<strong>on</strong>nées <str<strong>on</strong>g>sur</str<strong>on</strong>g> <str<strong>on</strong>g>les</str<strong>on</strong>g> opiacés ne se réfèrent qu'à l'héroïne.- Allemagne : Les d<strong>on</strong>nées ne se réfèrent qu'aux centres spécialisés de traitement des malades externes (695 des 1017 centres); Les patients (30 109) s<strong>on</strong>t traités pour plus d’une substance.- France: Le nombre total de patients déclarés 28 363; estimati<strong>on</strong>s basées <str<strong>on</strong>g>sur</str<strong>on</strong>g> 51% de rép<strong>on</strong>ses des centres spécialisés de traitement en 2001.- Italie : Le nombre total de patients traités pour usage de drogue 156 000; D<strong>on</strong>nées provenant des centres de traitement public et privés de médecine interne et ambulatoire (pour [patients extern- Pays Bas : Nombre de pers<strong>on</strong>nes traitées 28 311; Les d<strong>on</strong>nées se réfèrent aux centres de traitement ambulatoires.- Portugal : Les d<strong>on</strong>nées se réfèrent aux instituti<strong>on</strong>s de traitement ambulatoires, el<str<strong>on</strong>g>les</str<strong>on</strong>g> c<strong>on</strong>cernent 53% de tous <str<strong>on</strong>g>les</str<strong>on</strong>g> clients de ces instituti<strong>on</strong>s.La répartiti<strong>on</strong> par drogue est faite à partir de l’informati<strong>on</strong> <str<strong>on</strong>g>sur</str<strong>on</strong>g> la principale substance utilisée au cours des 30 jours précédant le traitement.- Suède: Nombre de pers<strong>on</strong>nes recevant le traitement 2997; Les d<strong>on</strong>nées se réfèrent aux hôpitaux, aux instituti<strong>on</strong>s de soins, aux cliniques de base ("walk in clinics") et pris<strong>on</strong>s : 138 unités à peu près,600 en tout en Suède.- Royaume-Uni: Le nombre de pers<strong>on</strong>nes ayant reçu un traitement 74 546. D<strong>on</strong>nées se référant aux agences spécialisées en <str<strong>on</strong>g>drogues</str<strong>on</strong>g>, médecins généralistes, et des centres de réhabilitati<strong>on</strong>s.D<strong>on</strong>nées portant <str<strong>on</strong>g>sur</str<strong>on</strong>g> la période allant du 1 er avril 2001 au 31 mars 2002Sources: ONUDC, D<strong>on</strong>nées en provenance des informati<strong>on</strong>s du questi<strong>on</strong>naire destiné aux rapports annuels et de L'OEDT 2004, rapports des gouvernements.379
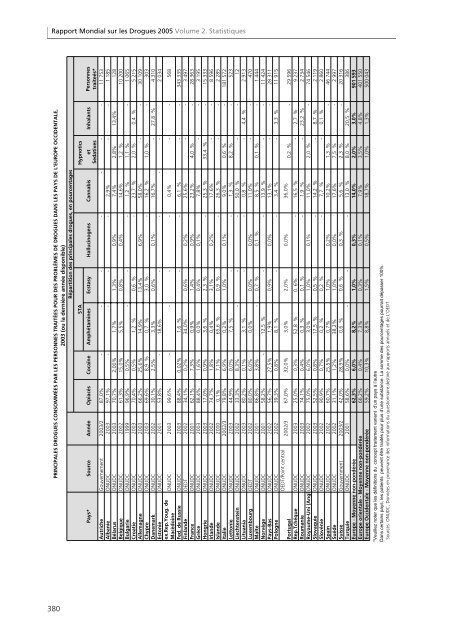
<str<strong>on</strong>g>Rapport</str<strong>on</strong>g> M<strong>on</strong>dial <str<strong>on</strong>g>sur</str<strong>on</strong>g> <str<strong>on</strong>g>les</str<strong>on</strong>g> Drogues <str<strong>on</strong>g>2005</str<strong>on</strong>g> Volume 2. StatistiquesPRINCIPALES DROGUES CONSOMMÉES PAR LES PERSONNES TRAITÉES POUR DES PROBLÈMES DE DROGUES DANS LES PAYS DE L'EUROPE OCCIDENTALE,2003 (ou la dernière année disp<strong>on</strong>ible)Répartiti<strong>on</strong> des principa<str<strong>on</strong>g>les</str<strong>on</strong>g> <str<strong>on</strong>g>drogues</str<strong>on</strong>g>, en pourcentagesHypnoticsPays* Source Année Opiacés Cocaïne Amphétamines Ecstasy Hallucinogens Cannabis et Inhalants Pers<strong>on</strong>nesSedativestraiteés*Autriche Gouvernement 2003/2 87,0% - - - - - - - 11 753Albanie ONUDC 2003 97,1% - - - - 2,9% - - 1 185Bélarus ONUDC 2003 70,7% 2,00% 1,7% 1,3% 0,9% 7,4% 2,8% 13,4% 128Belgique ONUDC 2002 61,3% 15,0% 5,5% 0,8% 0,4% 14,6% 1,2 % 10 200Bulgarie ONUDC 1999 96,9% 0,5% - - - 1,2 % 1,1 % - 1 065Croatie ONUDC 2003 70,4% 0,5% 1,2 % 0,6 % - 23,7 % 2,0 % 0,4 % 5 215Allemagne ONUDC 2003 66,2% 25,6% 14,9% 13,4% 6,9% 58,0% - - 30 109Chypre ONUDC 2003 69,6% 8,9 % 0,7 % 3,0 % - 16,2 % 1,0 % - 303Danemark ONUDC 2002 30,1% 2,5% 3,3% 0,6% 0,1% 16,7% - 27,8 % 4 310Est<strong>on</strong>ie ONUDC 2001 53,8% - 18,6% - - - - 2 034ex.Rep.Youg. deMacèdoineONUDC 2003 99,6% - - - - 0,4% - - 568Fed. de Russie ONUDC 2003 88,4% 0,02% 1,6 % - - 6,1 % - - 343 335Finlande OEDT 2002 34,1% 0,2% 34,0% 0,6% 0,2% 25,6% - - 3 497France ONUDC 2001 62,1% 7,3% 0,9% 1,4% 0,9% 23,2% 4,0 % - 28 363Gréce ONUDC 2003 88,4% 1,6% 0,0% 0,4% 0,1% 7,8% - - 3 195H<strong>on</strong>grie ONUDC 2003 17,0% 0,9% 3,6 % 2,3 % - 25,3 % 33,4 % - 15 333Irlande ONUDC 2002 74,7% 1,8% 0,4% 3,1% 0,2% 17,6% - - 8 596Islande ONUDC 2000 0,1% 7,1% 65,6 % 0,9 % - 26,3 % - - 2 285Italie ONUDC 2002/3 79,8% 6,9% 0,2% 1,0% 0,1% 9,0% 0,6 % - 181 572Lett<strong>on</strong>ie ONUDC 2003 44,9% 0,0% 7,5 % - - 1,3 % 8,2 % - 523Liechtenstein ONUDC 2002 33,3% 8,3% - - - 50,0 % - - 12Lituania ONUDC 2003 80,2% 0,1% 3,1 % - - 0,8 % - 4,4 % 2 913Luxembourg OEDT 2002 80,0% 6,0% 0,0% 0,0% 0,0% 11,0% - - 470Malte ONUDC 2001 86,8% 3,8% - 0,7 % 0,1 % 8,5 % 0,1 % - 1 444Norvège ONUDC 2001 58,2% - 12,5 % - - 13,9 % - - 11 424Pays-Bas ONUDC 2002 56,7% 27,5% 1,9% 0,9% 0,0% 13,1% - - 28 311Pologne ONUDC 2002 39,3% 0,8% 8,1 % - - 3,4 % - 3,3 % 11 915PortugalOEDT/Point centralSTA2002/3 67,0% 32,0% 3,0% 2,0% 0,0% 36,0%0,2 % - 29 596Rep.Tchéque ONUDC 2003 25,0% 0,3% 52,8 % 0. 6% - 16,5 % - 2,7 % 9 237Roumanie ONUDC 2003 74,1% 0,4% 0,3 % 0,1 % - 1,9 % - 23,2 % 2 734Royaume-Uni (Angl ONUDC 2002 75,0% 6,0% 3,0% 1,0% 0,1% 11,0% 2,0 % - 74 546Slovaquie ONUDC 2003 52,5% 0,8% 17,5 % 0,5 % - 14,2 % - 8,7 % 2 119Slovénie ONUDC 2002 90,9% 0,7% 0,2 % 0,2 % - 7,7 % - 0,1 % 2 860Spain ONUDC 2002 60,7% 25,5% 0,7% 1,0% 0,2% 10,2% 1,3 % - 46 744Suéde ONUDC 2002 31,1% 1,2% 38,2% 1,0% 0,0% 17,6% 7,5 % - 2 997Suisse Gouvernment 2003/2 42,0% 28,9% 0,6 % 0,6 % 0,3 % 5,6 % 2,3 % - 20 316Turquie ONUDC 2001 58,6% 0,0% - - - 13,0 % 8,0 % 20,5 % 386Europe - Moyenne n<strong>on</strong>-p<strong>on</strong>dérée 62,3% 6,0% 8,2% 1,0% 0,3% 14,0% 2,0% 3,0% 901 593Europe orientale - Moyenne n<strong>on</strong>-p<strong>on</strong>dérée 66,2% 0,4% 7,3% 0,3% 0,1% 7,9% 3,5% 4,8% 401 550Europe Occidentale - Moyenne n<strong>on</strong>-p<strong>on</strong>dérée 59,2% 10,3% 8,8% 1,5% 0,5% 18,7% 1,0% 1,3% 500 043*Veuillez noter que <str<strong>on</strong>g>les</str<strong>on</strong>g> définiti<strong>on</strong>s du c<strong>on</strong>cept traitement varient d’un pays á l’autreDans certains pays, <str<strong>on</strong>g>les</str<strong>on</strong>g> patients peuvent être traités pour plus d’une substance. La somme des pourcentages pourrait dépasser 100%Sources: ONUDC, D<strong>on</strong>nées en provenance des informati<strong>on</strong>s du questi<strong>on</strong>naire destiné aux rapports annuels et de L'OEDT.380
- Page 1:
2005RAPPORT MONDIA
- Page 4 and 5:
L'Office pour le c
- Page 6 and 7:
Table des matièresVolume 1. Analys
- Page 9:
5. PRODUCTION
- Page 13 and 14:
5.1. Production : Opium/Héroïne5.
- Page 15 and 16:
5.1. Production : Opium/HéroïneFi
- Page 17 and 18:
5.1. Production : Opium/HéroïneAf
- Page 19 and 20:
5.1. Production : Opium/HéroïneAf
- Page 21 and 22:
5.1. Production : Opium/HéroïneAf
- Page 23 and 24:
5.1. Production : Opium/Héroïne70
- Page 25 and 26:
5.1. Production : Opium/HéroïneFi
- Page 27 and 28:
5.1. Production : Opium/HéroïneMy
- Page 29 and 30:
5.1. Production : Opium/HéroïneMy
- Page 31 and 32:
5.1. Production : Opium/Héroïne5.
- Page 33 and 34:
5.1. Production : Opium/HéroïneGr
- Page 35 and 36:
5.1. Production : Opium/HéroïneRD
- Page 37:
5.1. Production : Opium/HéroïneR
- Page 40 and 41:
Rapport mo
- Page 42 and 43:
Rapport mo
- Page 44 and 45:
Rapport mo
- Page 46 and 47:
Rapport mo
- Page 48 and 49:
Rapport mo
- Page 50 and 51:
Rapport mo
- Page 52 and 53:
Rapport mo
- Page 54 and 55:
Rapport mo
- Page 56 and 57:
Rapport mo
- Page 58 and 59:
Rapport mo
- Page 60 and 61:
Rapport mo
- Page 62 and 63:
Rapport mo
- Page 64 and 65:
Rapport mo
- Page 67 and 68:
5.1. Production: Cannabis5.3. Canna
- Page 69 and 70:
5.1. Production: CannabisGraphiques
- Page 71 and 72:
5.1. Production: CannabisMaroc - Pr
- Page 73 and 74:
5.1. Production: Cannabis5.4. Stimu
- Page 75 and 76:
5.1. Production: CannabisRégion So
- Page 77 and 78:
5.1. Production: Autres dro
- Page 79 and 80:
5.1. Production: Autres dro
- Page 81 and 82:
Rapport Mondial <s
- Page 83 and 84:
Rapport Mondial <s
- Page 85 and 86:
Rapport Mondial <s
- Page 87 and 88:
Rapport Mondial <s
- Page 89 and 90:
Rapport Mondial <s
- Page 91 and 92:
Rapport Mondial <s
- Page 93 and 94:
Rapport Mondial <s
- Page 95 and 96:
Rapport Mondial <s
- Page 97 and 98:
Rapport Mondial <s
- Page 99 and 100:
Rapport Mondial <s
- Page 101 and 102:
Rapport Mondial <s
- Page 103 and 104:
Rapport Mondial <s
- Page 105 and 106:
Rapport Mondial <s
- Page 107 and 108:
Rapport Mondial <s
- Page 109 and 110:
Rapport Mondial <s
- Page 111 and 112:
Rapport Mondial <s
- Page 113 and 114:
Rapport Mondial <s
- Page 115 and 116:
Rapport Mondial <s
- Page 117 and 118:
Rapport Mondial <s
- Page 119 and 120:
Rapport Mondial <s
- Page 121 and 122:
Rapport Mondial <s
- Page 123 and 124:
Rapport Mondial <s
- Page 125 and 126:
Rapport Mondial <s
- Page 127 and 128:
Rapport Mondial <s
- Page 129 and 130:
Rapport Mondial <s
- Page 131 and 132:
Rapport Mondial <s
- Page 133 and 134:
Rapport Mondial <s
- Page 135 and 136:
Rapport Mondial <s
- Page 137 and 138:
Rapport Mondial <s
- Page 139 and 140:
Rapport Mondial <s
- Page 141 and 142:
Rapport Mondial <s
- Page 143 and 144:
Rapport Mondial <s
- Page 145 and 146:
Rapport Mondial <s
- Page 147 and 148:
Rapport Mondial <s
- Page 149 and 150:
Rapport Mondial <s
- Page 151 and 152: Rapport Mondial <s
- Page 153 and 154: Rapport Mondial <s
- Page 155 and 156: Rapport Mondial <s
- Page 157 and 158: Rapport Mondial <s
- Page 159 and 160: Rapport Mondial <s
- Page 161 and 162: Rapport Mondial <s
- Page 163 and 164: Rapport Mondial <s
- Page 165 and 166: Rapport Mondial <s
- Page 167 and 168: Rapport Mondial <s
- Page 169 and 170: Rapport Mondial <s
- Page 172 and 173: 7.Prix7.1. Opiacés: Prix de détai
- Page 174 and 175: 7.PrixHEROÏNEPrix de détail, de g
- Page 176 and 177: 7.PrixHEROÏNEPrix de détail, de g
- Page 178 and 179: 7.PrixCOCAÏNEPrix de détail, de g
- Page 180 and 181: 7.PrixCOCAÏNEPrix de détail, de g
- Page 182 and 183: 7.PrixFEUILLE DE CANNABISPrix de d
- Page 184 and 185: 7.PrixRÉSINE DE CANNABISPrix de d
- Page 186 and 187: 7.Prix7.4. Stimulants de type amph
- Page 188 and 189: 7.PrixL.S.DPrix de détail, de gros
- Page 190 and 191: 7.PrixPRIX DE DETAIL (au comprimé)
- Page 192: 8. CONSOMMATION
- Page 195 and 196: Rapport Mondial <s
- Page 197 and 198: Rapport Mondial <s
- Page 199 and 200: Rapport Mondial <s
- Page 201: Rapport Mondial <s
- Page 205 and 206: Rapport Mondial <s
- Page 207 and 208: Rapport Mondial <s
- Page 209 and 210: Rapport mo
- Page 211 and 212: Rapport mo
- Page 213 and 214: Rapport mo
- Page 215 and 216: Rapport mo
- Page 217 and 218: Rapport mo
- Page 219 and 220: Rapport mo
- Page 221 and 222: Rapport mo
- Page 223 and 224: Rapport mo
- Page 225 and 226: Rapport mo
- Page 227 and 228: Rapport mo
- Page 229 and 230: Rapport mo
- Page 232 and 233: Printed in SlovakiaDecember <strong