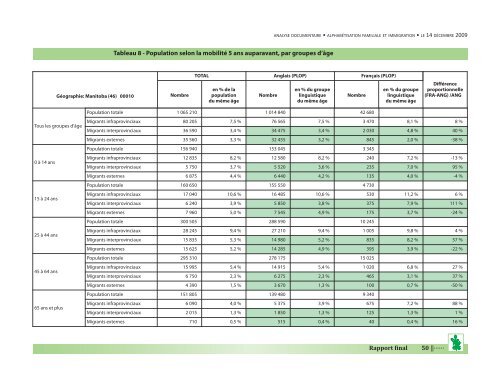
ANALYSE DOCUMENTAIRE • ALPHABÉTISATION FAMILIALE ET IMMIGRATION • LE 14 DÉCEMBRE 2009Tableau 8 - Population selon la mobilité 5 ans auparavant, par groupes d’âgeGéographie: Manitoba (46) 00010 NombreTOTAL Anglais (PLOP) Français (PLOP)<strong>en</strong> % <strong>de</strong> lapopulationdu même âgeNombre<strong>en</strong> % du groupelinguistiquedu même âgeNombre<strong>en</strong> % du groupelinguistiquedu même âgeDiffér<strong>en</strong>ceproportionnelle(FRA-ANG) /ANGTous les groupes d’âge0 à 14 ans15 à 24 ans25 à 44 ans45 à 64 ans65 ans <strong>et</strong> plusPopulation totale 1 065 210 1 014 840 42 680Migrants infraprovinciaux 80 205 7,5 % 76 565 7,5 % 3 470 8,1 % 8 %Migrants interprovinciaux 36 590 3,4 % 34 475 3,4 % 2 030 4,8 % 40 %Migrants externes 35 560 3,3 % 32 455 3,2 % 845 2,0 % -38 %Population totale 156 940 153 045 3 345Migrants infraprovinciaux 12 835 8,2 % 12 580 8,2 % 240 7,2 % -13 %Migrants interprovinciaux 5 750 3,7 % 5 520 3,6 % 235 7,0 % 95 %Migrants externes 6 875 4,4 % 6 440 4,2 % 135 4,0 % -4 %Population totale 160 650 155 550 4 730Migrants infraprovinciaux 17 040 10,6 % 16 485 10,6 % 530 11,2 % 6 %Migrants interprovinciaux 6 240 3,9 % 5 850 3,8 % 375 7,9 % 111 %Migrants externes 7 960 5,0 % 7 545 4,9 % 175 3,7 % -24 %Population totale 300 505 288 590 10 245Migrants infraprovinciaux 28 245 9,4 % 27 210 9,4 % 1 005 9,8 % 4 %Migrants interprovinciaux 15 835 5,3 % 14 980 5,2 % 835 8,2 % 57 %Migrants externes 15 625 5,2 % 14 285 4,9 % 395 3,9 % -22 %Population totale 295 310 278 175 15 025Migrants infraprovinciaux 15 995 5,4 % 14 915 5,4 % 1 020 6,8 % 27 %Migrants interprovinciaux 6 750 2,3 % 6 275 2,3 % 465 3,1 % 37 %Migrants externes 4 390 1,5 % 3 670 1,3 % 100 0,7 % -50 %Population totale 151 805 139 480 9 340Migrants infraprovinciaux 6 090 4,0 % 5 375 3,9 % 675 7,2 % 88 %Migrants interprovinciaux 2 015 1,3 % 1 850 1,3 % 125 1,3 % 1 %Migrants externes 710 0,5 % 515 0,4 % 40 0,4 % 16 %Rapport inal 50 ||······
ANALYSE DOCUMENTAIRE • ALPHABÉTISATION FAMILIALE ET IMMIGRATION • LE 14 DÉCEMBRE 20099.1.4. Immigration au Manitoba : portrait global <strong>et</strong> immigration réc<strong>en</strong>te (2001-2006)Le Tableau 9, le Tableau 10 <strong>et</strong> le Tableau 11 donn<strong>en</strong>t le portrait <strong>de</strong> l’immigration au Manitoba. Le terme « nouveauximmigrants » compr<strong>en</strong>d les personnes immigrantes qui ont déménagé au Manitoba <strong>en</strong>tre le 1 er janvier 2001 <strong>et</strong> le 16mai 2006. C<strong>et</strong>te donnée compr<strong>en</strong>d l’immigration primaire <strong>et</strong> secondaire.Les faits saillants sont les suivants :• Parmi les francophones, 2 705 personnes sont <strong>de</strong>s immigrants, soit 6,1 % <strong>de</strong> la population francophone totale. Encomparaison, parmi les anglophones, on dénombre 142 075 immigrants (13,2 %). C<strong>et</strong>te donnée reflète la t<strong>en</strong>dancehistorique qui favorisait largem<strong>en</strong>t l’immigration d’expression anglaise <strong>et</strong> confirme la nécessité du plan provincial<strong>en</strong> immigration qui prévoit que 7 % <strong>de</strong> tous les nouveaux immigrants au Manitoba seront d’expression française.• Les immigrants francophones provi<strong>en</strong>n<strong>en</strong>t surtout <strong>de</strong> l’Europe (1 315 immigrants, soit 49 % <strong>de</strong>s immigrantsfrancophones), <strong>de</strong> l’Afrique (755 immigrants, soit 28 %) <strong>et</strong> <strong>de</strong> l’Asie <strong>et</strong> du Moy<strong>en</strong>-Ori<strong>en</strong>t (305 immigrants, soit 11 %).• Parmi les francophones <strong>de</strong> 0 à 14 ans, on dénombre 275 <strong>en</strong>fants immigrants (5,8 %), dont 190 nouveauximmigrants (4,0 % <strong>de</strong> la population francophone du même groupe d’âge <strong>et</strong> 69,1 % <strong>de</strong>s immigrants francophones<strong>de</strong> ce groupe d’âge). Ce groupe d’âge compte pour 26,0 % <strong>de</strong>s nouveaux immigrants francophones.• En comparaison, parmi les anglophones <strong>de</strong> 0 à 14 ans, on dénombre 10 255 <strong>en</strong>fants immigrants (4,7 %), dont 7 425nouveaux immigrants (3,4 %<strong>de</strong> la population anglophone du même groupe d’âge <strong>et</strong> 72,4 % <strong>de</strong>s immigrantsanglophones <strong>de</strong> ce groupe d’âge). Ce groupe d’âge compte pour 26,3 % <strong>de</strong>s nouveaux immigrants anglophones.• Parmi les francophones <strong>de</strong> 15 à 24 ans, on dénombre 370 personnes immigrantes (7,8 %), dont 120 nouveauximmigrants (2,5 % <strong>de</strong> la population francophone du même groupe d’âge <strong>et</strong> 32,4 % <strong>de</strong>s immigrants francophones<strong>de</strong> ce groupe d’âge). Ce groupe d’âge compte pour 16,4 % <strong>de</strong>s nouveaux immigrants francophones.• En comparaison, parmi les anglophones <strong>de</strong> 15 à 24 ans, on dénombre 12 600 immigrants (8,1 %), dont 5 340nouveaux immigrants (3,4 % <strong>de</strong> la population anglophone du même groupe d’âge <strong>et</strong> 42,4 % <strong>de</strong>s immigrantsanglophones <strong>de</strong> ce groupe d’âge). Ce groupe d’âge compte pour 18,9 % <strong>de</strong>s nouveaux immigrants anglophones.• En ce qui concerne l’immigration réc<strong>en</strong>te, 730 immigrants francophones ont déménagé au Manitoba <strong>en</strong>tre 2001 <strong>et</strong>2006. Il est notable que 645 personnes parmi ce groupe viv<strong>en</strong>t à Winnipeg. La répartition parmi les groupesd’âge est la suivante :º 0 à 14 ans : 190 personnesº 15 à 24 ans : 120 personnesº 25 à 44 ans : 320 personnesº 45 à 64 ans : 95 personnesLa répartition selon les régions d’origine est la suivante :º Afrique : 51 %º Europe : 25 %º Asie <strong>et</strong> Moy<strong>en</strong>-Ori<strong>en</strong>t : 13 %Rapport inal 51 ||······