Annual Report - PT SMART Tbk
Annual Report - PT SMART Tbk
Annual Report - PT SMART Tbk
- No tags were found...

You also want an ePaper? Increase the reach of your titles
YUMPU automatically turns print PDFs into web optimized ePapers that Google loves.
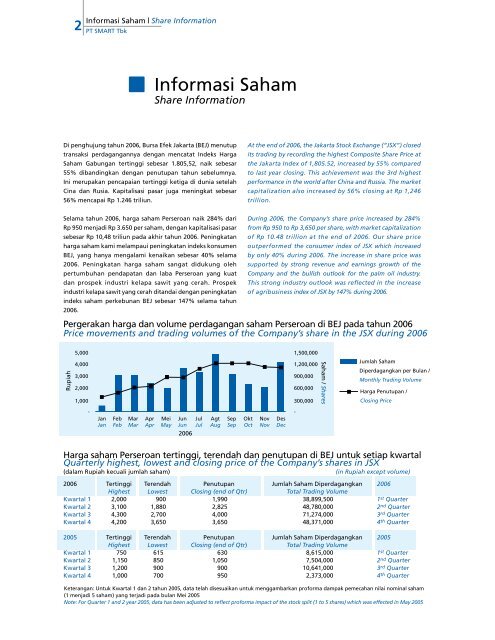
2Informasi Saham | Share Information<strong>PT</strong> <strong>SMART</strong> <strong>Tbk</strong>Informasi SahamShare InformationDi penghujung tahun 2006, Bursa Efek Jakarta (BEJ) menutuptransaksi perdagangannya dengan mencatat Indeks HargaSaham Gabungan tertinggi sebesar 1.805,52, naik sebesar55% dibandingkan dengan penutupan tahun sebelumnya.Ini merupakan pencapaian tertinggi ketiga di dunia setelahCina dan Rusia. Kapitalisasi pasar juga meningkat sebesar56% mencapai Rp 1.246 triliun.At the end of 2006, the Jakarta Stock Exchange (“JSX”) closedits trading by recording the highest Composite Share Price atthe Jakarta Index of 1,805.52, increased by 55% comparedto last year closing. This achievement was the 3rd highestperformance in the world after China and Russia. The marketcapitalization also increased by 56% closing at Rp 1,246trillion.Selama tahun 2006, harga saham Perseroan naik 284% dariRp 950 menjadi Rp 3.650 per saham, dengan kapitalisasi pasarsebesar Rp 10,48 triliun pada akhir tahun 2006. Peningkatanharga saham kami melampaui peningkatan indeks konsumenBEJ, yang hanya mengalami kenaikan sebesar 40% selama2006. Peningkatan harga saham sangat didukung olehpertumbuhan pendapatan dan laba Perseroan yang kuatdan prospek industri kelapa sawit yang cerah. Prospekindustri kelapa sawit yang cerah ditandai dengan peningkatanindeks saham perkebunan BEJ sebesar 147% selama tahun2006.During 2006, the Company’s share price increased by 284%from Rp 950 to Rp 3,650 per share, with market capitalizationof Rp 10.48 trillion at the end of 2006. Our share priceoutperformed the consumer index of JSX which increasedby only 40% during 2006. The increase in share price wassupported by strong revenue and earnings growth of theCompany and the bullish outlook for the palm oil industry.This strong industry outlook was reflected in the increaseof agribusiness index of JSX by 147% during 2006.Pergerakan harga dan volume perdagangan saham Perseroan di BEJ pada tahun 2006Price movements and trading volumes of the Company’s share in the JSX during 2006Rupiah5,0004,0003,0002,0001,0001,500,0001,200,000900,000600,000300,000Saham / SharesJumlah SahamDiperdagangkan per Bulan /Monthly Trading VolumeHarga Penutupan /Closing Price-Jan Feb Mar Apr Mei Jun Jul Agt Sep Okt Nov DesJan Feb Mar Apr May Jun Jul Aug Sep Oct Nov Dec2006-Harga saham Perseroan tertinggi, terendah dan penutupan di BEJ untuk setiap kwartalQuarterly highest, lowest and closing price of the Company’s shares in JSX(dalam Rupiah kecuali jumlah saham)2006Kwartal 1Kwartal 2Kwartal 3Kwartal 4TertinggiHighest2,0003,1004,3004,200TerendahLowest9001,8802,7003,650PenutupanClosing (end of Qtr)1,9902,8254,0003,650Jumlah Saham DiperdagangkanTotal Trading Volume38,899,50048,780,00071,274,00048,371,000(in Rupiah except volume)20061 st Quarter2 nd Quarter3 rd Quarter4 th Quarter2005Kwartal 1Kwartal 2Kwartal 3Kwartal 4TertinggiHighest7501,1501,2001,000TerendahLowest615850900700PenutupanClosing (end of Qtr)6301,050900950Jumlah Saham DiperdagangkanTotal Trading Volume8,615,0007,504,00010,641,0002,373,00020051 st Quarter2 nd Quarter3 rd Quarter4 th QuarterKeterangan: Untuk Kwartal 1 dan 2 tahun 2005, data telah disesuaikan untuk menggambarkan proforma dampak pemecahan nilai nominal saham(1 menjadi 5 saham) yang terjadi pada bulan Mei 2005Note: For Quarter 1 and 2 year 2005, data has been adjusted to reflect proforma impact of the stock split (1 to 5 shares) which was effected in May 2005