V.Inc.A - Provincia di Padova
V.Inc.A - Provincia di Padova
V.Inc.A - Provincia di Padova

You also want an ePaper? Increase the reach of your titles
YUMPU automatically turns print PDFs into web optimized ePapers that Google loves.
Piano <strong>Provincia</strong>le Valutazione <strong>di</strong> <strong>Inc</strong>idenza Ambientale<br />
per la Gestione dei Rifiuti Urbani 2010-2019<br />
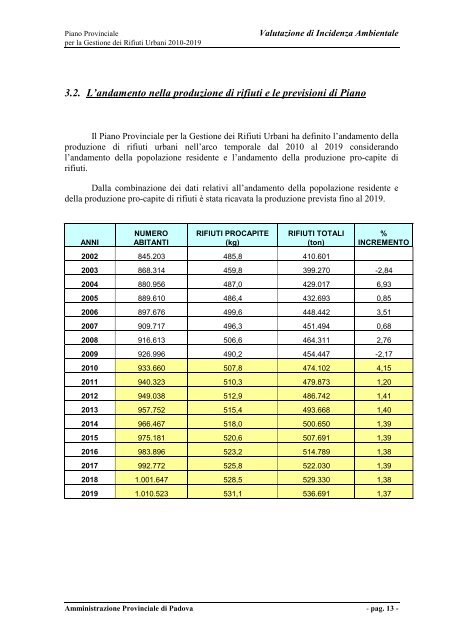
3.2. L’andamento nella produzione <strong>di</strong> rifiuti e le previsioni <strong>di</strong> Piano<br />
Il Piano <strong>Provincia</strong>le per la Gestione dei Rifiuti Urbani ha definito l’andamento della<br />
produzione <strong>di</strong> rifiuti urbani nell’arco temporale dal 2010 al 2019 considerando<br />
l’andamento della popolazione residente e l’andamento della produzione pro-capite <strong>di</strong><br />
rifiuti.<br />
Dalla combinazione dei dati relativi all’andamento della popolazione residente e<br />
della produzione pro-capite <strong>di</strong> rifiuti è stata ricavata la produzione prevista fino al 2019.<br />
ANNI<br />
NUMERO<br />
ABITANTI<br />
RIFIUTI PROCAPITE<br />
(kg)<br />
RIFIUTI TOTALI<br />
(ton)<br />
2002 845.203 485,8 410.601<br />
%<br />
INCREMENTO<br />
2003 868.314 459,8 399.270 -2,84<br />
2004 880.956 487,0 429.017 6,93<br />
2005 889.610 486,4 432.693 0,85<br />
2006 897.676 499,6 448.442 3,51<br />
2007 909.717 496,3 451.494 0,68<br />
2008 916.613 506,6 464.311 2,76<br />
2009 926.996 490,2 454.447 -2,17<br />
2010 933.660 507,8 474.102 4,15<br />
2011 940.323 510,3 479.873 1,20<br />
2012 949.038 512,9 486.742 1,41<br />
2013 957.752 515,4 493.668 1,40<br />
2014 966.467 518,0 500.650 1,39<br />
2015 975.181 520,6 507.691 1,39<br />
2016 983.896 523,2 514.789 1,38<br />
2017 992.772 525,8 522.030 1,39<br />
2018 1.001.647 528,5 529.330 1,38<br />
2019 1.010.523 531,1 536.691 1,37<br />
Amministrazione <strong>Provincia</strong>le <strong>di</strong> <strong>Padova</strong> - pag. 13 -