4-2019
Fachzeitschrift für Hochfrequenz- und Mikrowellentechnik
Fachzeitschrift für Hochfrequenz- und Mikrowellentechnik

Erfolgreiche ePaper selbst erstellen
Machen Sie aus Ihren PDF Publikationen ein blätterbares Flipbook mit unserer einzigartigen Google optimierten e-Paper Software.
RF & Wireless<br />
In this example, the feed network<br />
is simulated entirely in the<br />
circuit simulator. A more realistic<br />
example would simulate the<br />
layout of the feed network in an<br />
EM simulator to make sure the<br />
models are accurate and there is<br />
no unintended coupling between<br />
sections of the network.<br />
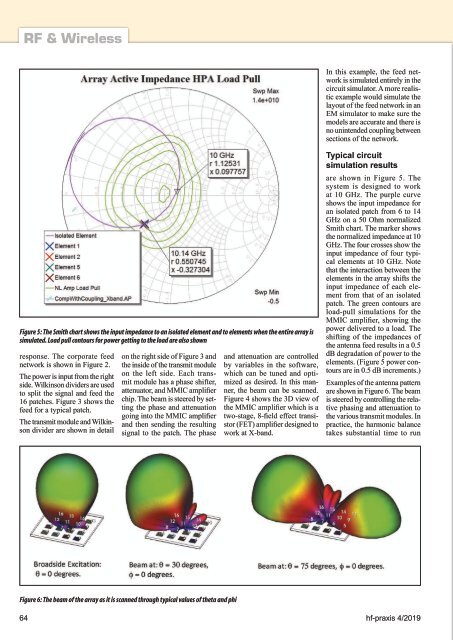
Figure 5: The Smith chart shows the input impedance to an isolated element and to elements when the entire array is<br />
simulated. Load pull contours for power getting to the load are also shown<br />
response. The corporate feed<br />
network is shown in Figure 2.<br />
The power is input from the right<br />
side. Wilkinson dividers are used<br />
to split the signal and feed the<br />
16 patches. Figure 3 shows the<br />
feed for a typical patch.<br />
The transmit module and Wilkinson<br />
divider are shown in detail<br />
on the right side of Figure 3 and<br />
the inside of the transmit module<br />
on the left side. Each transmit<br />
module has a phase shifter,<br />
attenuator, and MMIC amplifier<br />
chip. The beam is steered by setting<br />
the phase and attenuation<br />
going into the MMIC amplifier<br />
and then sending the resulting<br />
signal to the patch. The phase<br />
and attenuation are controlled<br />
by variables in the software,<br />
which can be tuned and optimized<br />
as desired. In this manner,<br />
the beam can be scanned.<br />
Figure 4 shows the 3D view of<br />
the MMIC amplifier which is a<br />
two-stage, 8-field effect transistor<br />
(FET) amplifier designed to<br />
work at X-band.<br />
Typical circuit<br />
simulation results<br />
are shown in Figure 5. The<br />
system is designed to work<br />
at 10 GHz. The purple curve<br />
shows the input impedance for<br />
an isolated patch from 6 to 14<br />
GHz on a 50 Ohm normalized<br />
Smith chart. The marker shows<br />
the normalized impedance at 10<br />
GHz. The four crosses show the<br />
input impedance of four typical<br />
elements at 10 GHz. Note<br />
that the interaction between the<br />
elements in the array shifts the<br />
input impedance of each element<br />
from that of an isolated<br />
patch. The green contours are<br />
load-pull simulations for the<br />
MMIC amplifier, showing the<br />
power delivered to a load. The<br />
shifting of the impedances of<br />
the antenna feed results in a 0.5<br />
dB degradation of power to the<br />
elements. (Figure 5 power contours<br />
are in 0.5 dB increments.)<br />
Examples of the antenna pattern<br />
are shown in Figure 6. The beam<br />
is steered by controlling the relative<br />
phasing and attenuation to<br />
the various transmit modules. In<br />
practice, the harmonic balance<br />
takes substantial time to run<br />
Figure 6: The beam of the array as it is scanned through typical values of theta and phi<br />
64 hf-praxis 4/<strong>2019</strong>