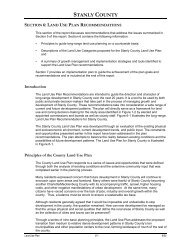
Land Use Plan – 2002 - Stanly County, North Carolina
Land Use Plan – 2002 - Stanly County, North Carolina
Land Use Plan – 2002 - Stanly County, North Carolina

You also want an ePaper? Increase the reach of your titles
YUMPU automatically turns print PDFs into web optimized ePapers that Google loves.
STANLY COUNTY<br />
Table 2-7 provides a comparative breakdown of the age distribution of <strong>Stanly</strong> <strong>County</strong> from 1990<br />
and 2000. The table illustrates the aging of <strong>Stanly</strong> <strong>County</strong> that took place from 1990 to 2000. In<br />
1990, the largest age cohort was the 25 to 34 age group (15.3 percent of population); while in<br />
2000, the 35 to 44 cohort (15.5 percent) was the largest. Significant growth occurred—in<br />
percentage terms—for the 45 to 54, 35 to 44, and 10 to 14 age cohorts. Decreases occurred in<br />
the 25 to 34, 20 to 24, 65 to 74, and 15 to 19 age cohorts.<br />
Table 2-7. Age Distribution, <strong>Stanly</strong> <strong>County</strong>, 1990-2000.<br />
1990 2000 2000<br />
Percentage<br />
Increase<br />
Age 1990 Percent Estimates Percent 1990-2000<br />
0-4 3,746 7.2 3,624 7.2 —<br />
5-9 3,452 6.7 4,175 7.2 0.5<br />
10-14 3,395 6.6 4,334 7.5 0.9<br />
15-19 3,807 7.4 3,870 6.7 -0.7<br />
20-24 3,762 7.3 3,374 5.8 -1.5<br />
25-34 7,901 15.3 7,851 13.5 -1.8<br />
35-44 7,488 14.5 9,022 15.5 1.0<br />
45-54 5,593 10.8 7,932 13.7 2.9<br />
55-59 2,544 4.9 3,103 5.3 0.4<br />
60-64 2,533 4.9 2,550 4.4 -0.5<br />
65-74 4,505 8.7 4,433 7.6 -1.1<br />
75-84 2,484 4.8 2,952 5.1 0.3<br />
85+ 555 1.1 880 1.5 0.4<br />
Total 51,765 58,100<br />
Source: State of <strong>North</strong> <strong>Carolina</strong> Office of State Budget, <strong>Plan</strong>ning and Management, 2000.<br />
Population Density<br />
Population density is an indication of the intensity of developed within a geographical area. In<br />
1990 <strong>Stanly</strong> <strong>County</strong> had a population density of 131.0 persons per square mile (Table 2-8). The<br />
2000 census indicated the population density increased by 12.3 percent to 147.1 persons per<br />
square mile, a growth rate similar to the national average of 12.7 percent. For the same period,<br />
the population density of the state of <strong>North</strong> <strong>Carolina</strong> grew 21.3 percent to a population density of<br />
165.2 persons per square mile.<br />
Table 2-8. Population Density (Persons Per Square Mile), Selected <strong>North</strong><br />
<strong>Carolina</strong> Counties, State of <strong>North</strong> <strong>Carolina</strong>, and the United States, 1990-2000.<br />
<strong>County</strong> 1990 2000 Percent Growth<br />
<strong>Stanly</strong> 131.0 147.1 12.3<br />
Anson 44.2 47.5 7.5<br />
Cabarrus 271.5 359.7 32.5<br />
Davidson 229.4 266.7 16.3<br />
Mecklenburg 971.8 1,321.5 36.0<br />
Montgomery 47.5 54.6 15.0<br />
Rowan 216.3 254.9 17.9<br />
Union 132.1 194.0 46.9<br />
State of <strong>North</strong> <strong>Carolina</strong> 136.2 165.2 21.3<br />
United States 70.3 79.2 12.7<br />
Source: US Census Bureau, 1990 and 1980.<br />
<strong>Land</strong> <strong>Use</strong> <strong>Plan</strong> 2-6 6/02