Land Use Plan – 2002 - Stanly County, North Carolina
Land Use Plan – 2002 - Stanly County, North Carolina
Land Use Plan – 2002 - Stanly County, North Carolina

You also want an ePaper? Increase the reach of your titles
YUMPU automatically turns print PDFs into web optimized ePapers that Google loves.
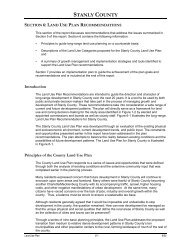
STANLY COUNTY<br />
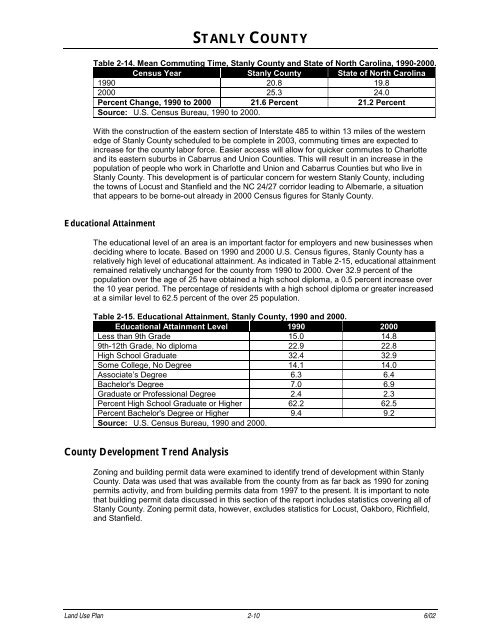
Table 2-14. Mean Commuting Time, <strong>Stanly</strong> <strong>County</strong> and State of <strong>North</strong> <strong>Carolina</strong>, 1990-2000.<br />
Census Year <strong>Stanly</strong> <strong>County</strong> State of <strong>North</strong> <strong>Carolina</strong><br />
1990 20.8 19.8<br />
2000 25.3 24.0<br />
Percent Change, 1990 to 2000 21.6 Percent 21.2 Percent<br />
Source: U.S. Census Bureau, 1990 to 2000.<br />
With the construction of the eastern section of Interstate 485 to within 13 miles of the western<br />
edge of <strong>Stanly</strong> <strong>County</strong> scheduled to be complete in 2003, commuting times are expected to<br />
increase for the county labor force. Easier access will allow for quicker commutes to Charlotte<br />
and its eastern suburbs in Cabarrus and Union Counties. This will result in an increase in the<br />
population of people who work in Charlotte and Union and Cabarrus Counties but who live in<br />
<strong>Stanly</strong> <strong>County</strong>. This development is of particular concern for western <strong>Stanly</strong> <strong>County</strong>, including<br />
the towns of Locust and Stanfield and the NC 24/27 corridor leading to Albemarle, a situation<br />
that appears to be borne-out already in 2000 Census figures for <strong>Stanly</strong> <strong>County</strong>.<br />
Educational Attainment<br />
The educational level of an area is an important factor for employers and new businesses when<br />
deciding where to locate. Based on 1990 and 2000 U.S. Census figures, <strong>Stanly</strong> <strong>County</strong> has a<br />
relatively high level of educational attainment. As indicated in Table 2-15, educational attainment<br />
remained relatively unchanged for the county from 1990 to 2000. Over 32.9 percent of the<br />
population over the age of 25 have obtained a high school diploma, a 0.5 percent increase over<br />
the 10 year period. The percentage of residents with a high school diploma or greater increased<br />
at a similar level to 62.5 percent of the over 25 population.<br />
Table 2-15. Educational Attainment, <strong>Stanly</strong> <strong>County</strong>, 1990 and 2000.<br />
Educational Attainment Level 1990 2000<br />
Less than 9th Grade 15.0 14.8<br />
9th-12th Grade, No diploma 22.9 22.8<br />
High School Graduate 32.4 32.9<br />
Some College, No Degree 14.1 14.0<br />
Associate’s Degree 6.3 6.4<br />
Bachelor's Degree 7.0 6.9<br />
Graduate or Professional Degree 2.4 2.3<br />
Percent High School Graduate or Higher 62.2 62.5<br />
Percent Bachelor's Degree or Higher 9.4 9.2<br />
Source: U.S. Census Bureau, 1990 and 2000.<br />
<strong>County</strong> Development Trend Analysis<br />
Zoning and building permit data were examined to identify trend of development within <strong>Stanly</strong><br />
<strong>County</strong>. Data was used that was available from the county from as far back as 1990 for zoning<br />
permits activity, and from building permits data from 1997 to the present. It is important to note<br />
that building permit data discussed in this section of the report includes statistics covering all of<br />
<strong>Stanly</strong> <strong>County</strong>. Zoning permit data, however, excludes statistics for Locust, Oakboro, Richfield,<br />
and Stanfield.<br />
<strong>Land</strong> <strong>Use</strong> <strong>Plan</strong> 2-10 6/02