Land Use Plan – 2002 - Stanly County, North Carolina
Land Use Plan – 2002 - Stanly County, North Carolina
Land Use Plan – 2002 - Stanly County, North Carolina
Create successful ePaper yourself
Turn your PDF publications into a flip-book with our unique Google optimized e-Paper software.
STANLY COUNTY<br />
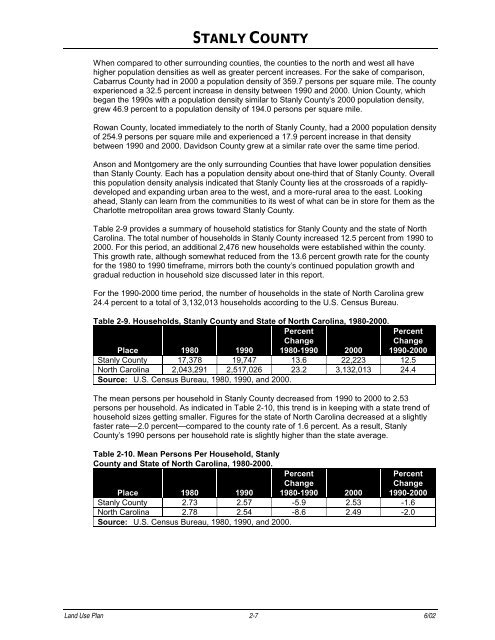
When compared to other surrounding counties, the counties to the north and west all have<br />
higher population densities as well as greater percent increases. For the sake of comparison,<br />
Cabarrus <strong>County</strong> had in 2000 a population density of 359.7 persons per square mile. The county<br />
experienced a 32.5 percent increase in density between 1990 and 2000. Union <strong>County</strong>, which<br />
began the 1990s with a population density similar to <strong>Stanly</strong> <strong>County</strong>’s 2000 population density,<br />
grew 46.9 percent to a population density of 194.0 persons per square mile.<br />
Rowan <strong>County</strong>, located immediately to the north of <strong>Stanly</strong> <strong>County</strong>, had a 2000 population density<br />
of 254.9 persons per square mile and experienced a 17.9 percent increase in that density<br />
between 1990 and 2000. Davidson <strong>County</strong> grew at a similar rate over the same time period.<br />
Anson and Montgomery are the only surrounding Counties that have lower population densities<br />
than <strong>Stanly</strong> <strong>County</strong>. Each has a population density about one-third that of <strong>Stanly</strong> <strong>County</strong>. Overall<br />
this population density analysis indicated that <strong>Stanly</strong> <strong>County</strong> lies at the crossroads of a rapidlydeveloped<br />
and expanding urban area to the west, and a more-rural area to the east. Looking<br />
ahead, <strong>Stanly</strong> can learn from the communities to its west of what can be in store for them as the<br />
Charlotte metropolitan area grows toward <strong>Stanly</strong> <strong>County</strong>.<br />
Table 2-9 provides a summary of household statistics for <strong>Stanly</strong> <strong>County</strong> and the state of <strong>North</strong><br />
<strong>Carolina</strong>. The total number of households in <strong>Stanly</strong> <strong>County</strong> increased 12.5 percent from 1990 to<br />
2000. For this period, an additional 2,476 new households were established within the county.<br />
This growth rate, although somewhat reduced from the 13.6 percent growth rate for the county<br />
for the 1980 to 1990 timeframe, mirrors both the county’s continued population growth and<br />
gradual reduction in household size discussed later in this report.<br />
For the 1990-2000 time period, the number of households in the state of <strong>North</strong> <strong>Carolina</strong> grew<br />
24.4 percent to a total of 3,132,013 households according to the U.S. Census Bureau.<br />
Table 2-9. Households, <strong>Stanly</strong> <strong>County</strong> and State of <strong>North</strong> <strong>Carolina</strong>, 1980-2000.<br />
Place 1980 1990<br />
Percent<br />
Change<br />
1980-1990 2000<br />
Percent<br />
Change<br />
1990-2000<br />
<strong>Stanly</strong> <strong>County</strong> 17,378 19,747 13.6 22,223 12.5<br />
<strong>North</strong> <strong>Carolina</strong> 2,043,291 2,517,026 23.2 3,132,013 24.4<br />
Source: U.S. Census Bureau, 1980, 1990, and 2000.<br />
The mean persons per household in <strong>Stanly</strong> <strong>County</strong> decreased from 1990 to 2000 to 2.53<br />
persons per household. As indicated in Table 2-10, this trend is in keeping with a state trend of<br />
household sizes getting smaller. Figures for the state of <strong>North</strong> <strong>Carolina</strong> decreased at a slightly<br />
faster rate—2.0 percent—compared to the county rate of 1.6 percent. As a result, <strong>Stanly</strong><br />
<strong>County</strong>’s 1990 persons per household rate is slightly higher than the state average.<br />
Table 2-10. Mean Persons Per Household, <strong>Stanly</strong><br />
<strong>County</strong> and State of <strong>North</strong> <strong>Carolina</strong>, 1980-2000.<br />
Place 1980 1990<br />
Percent<br />
Change<br />
1980-1990 2000<br />
Percent<br />
Change<br />
1990-2000<br />
<strong>Stanly</strong> <strong>County</strong> 2.73 2.57 -5.9 2.53 -1.6<br />
<strong>North</strong> <strong>Carolina</strong> 2.78 2.54 -8.6 2.49 -2.0<br />
Source: U.S. Census Bureau, 1980, 1990, and 2000.<br />
<strong>Land</strong> <strong>Use</strong> <strong>Plan</strong> 2-7 6/02


