Land Use Plan – 2002 - Stanly County, North Carolina
Land Use Plan – 2002 - Stanly County, North Carolina
Land Use Plan – 2002 - Stanly County, North Carolina

Create successful ePaper yourself
Turn your PDF publications into a flip-book with our unique Google optimized e-Paper software.
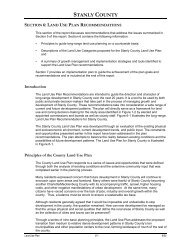
Employment Sectors<br />
STANLY COUNTY<br />
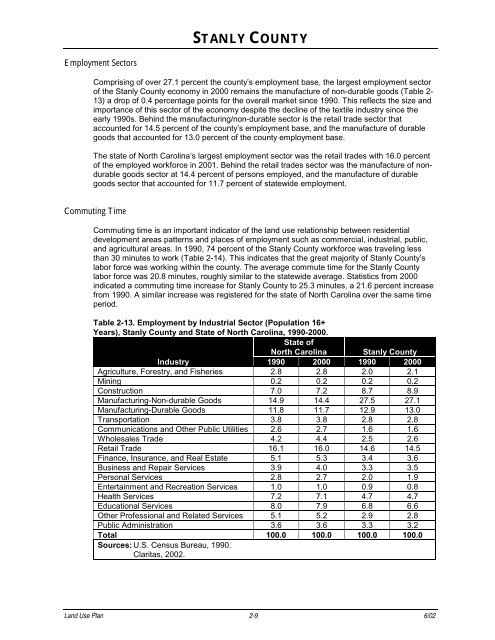
Comprising of over 27.1 percent the county’s employment base, the largest employment sector<br />
of the <strong>Stanly</strong> <strong>County</strong> economy in 2000 remains the manufacture of non-durable goods (Table 2-<br />
13) a drop of 0.4 percentage points for the overall market since 1990. This reflects the size and<br />
importance of this sector of the economy despite the decline of the textile industry since the<br />
early 1990s. Behind the manufacturing/non-durable sector is the retail trade sector that<br />
accounted for 14.5 percent of the county’s employment base, and the manufacture of durable<br />
goods that accounted for 13.0 percent of the county employment base.<br />
The state of <strong>North</strong> <strong>Carolina</strong>’s largest employment sector was the retail trades with 16.0 percent<br />
of the employed workforce in 2001. Behind the retail trades sector was the manufacture of nondurable<br />
goods sector at 14.4 percent of persons employed, and the manufacture of durable<br />
goods sector that accounted for 11.7 percent of statewide employment.<br />
Commuting Time<br />
Commuting time is an important indicator of the land use relationship between residential<br />
development areas patterns and places of employment such as commercial, industrial, public,<br />
and agricultural areas. In 1990, 74 percent of the <strong>Stanly</strong> <strong>County</strong> workforce was traveling less<br />
than 30 minutes to work (Table 2-14). This indicates that the great majority of <strong>Stanly</strong> <strong>County</strong>’s<br />
labor force was working within the county. The average commute time for the <strong>Stanly</strong> <strong>County</strong><br />
labor force was 20.8 minutes, roughly similar to the statewide average. Statistics from 2000<br />
indicated a commuting time increase for <strong>Stanly</strong> <strong>County</strong> to 25.3 minutes, a 21.6 percent increase<br />
from 1990. A similar increase was registered for the state of <strong>North</strong> <strong>Carolina</strong> over the same time<br />
period.<br />
Table 2-13. Employment by Industrial Sector (Population 16+<br />
Years), <strong>Stanly</strong> <strong>County</strong> and State of <strong>North</strong> <strong>Carolina</strong>, 1990-2000.<br />
State of<br />
<strong>North</strong> <strong>Carolina</strong> <strong>Stanly</strong> <strong>County</strong><br />
Industry 1990 2000 1990 2000<br />
Agriculture, Forestry, and Fisheries 2.8 2.8 2.0 2.1<br />
Mining 0.2 0.2 0.2 0.2<br />
Construction 7.0 7.2 8.7 8.9<br />
Manufacturing-Non-durable Goods 14.9 14.4 27.5 27.1<br />
Manufacturing-Durable Goods 11.8 11.7 12.9 13.0<br />
Transportation 3.8 3.8 2.8 2.8<br />
Communications and Other Public Utilities 2.6 2.7 1.6 1.6<br />
Wholesales Trade 4.2 4.4 2.5 2.6<br />
Retail Trade 16.1 16.0 14.6 14.5<br />
Finance, Insurance, and Real Estate 5.1 5.3 3.4 3.6<br />
Business and Repair Services 3.9 4.0 3.3 3.5<br />
Personal Services 2.8 2.7 2.0 1.9<br />
Entertainment and Recreation Services 1.0 1.0 0.9 0.8<br />
Health Services 7.2 7.1 4.7 4.7<br />
Educational Services 8.0 7.9 6.8 6.6<br />
Other Professional and Related Services 5.1 5.2 2.9 2.8<br />
Public Administration 3.6 3.6 3.3 3.2<br />
Total 100.0 100.0 100.0 100.0<br />
Sources: U.S. Census Bureau, 1990.<br />
Claritas, <strong>2002</strong>.<br />
<strong>Land</strong> <strong>Use</strong> <strong>Plan</strong> 2-9 6/02