Land Use Plan – 2002 - Stanly County, North Carolina
Land Use Plan – 2002 - Stanly County, North Carolina
Land Use Plan – 2002 - Stanly County, North Carolina

You also want an ePaper? Increase the reach of your titles
YUMPU automatically turns print PDFs into web optimized ePapers that Google loves.
Building Activity<br />
Zoning Permits<br />
STANLY COUNTY<br />
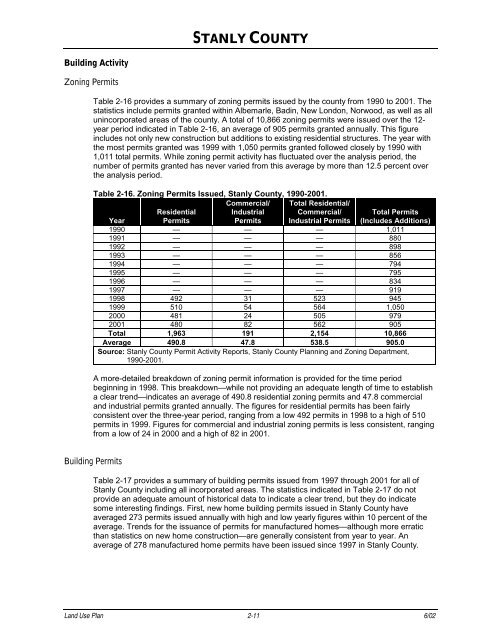
Table 2-16 provides a summary of zoning permits issued by the county from 1990 to 2001. The<br />
statistics include permits granted within Albemarle, Badin, New London, Norwood, as well as all<br />
unincorporated areas of the county. A total of 10,866 zoning permits were issued over the 12year<br />
period indicated in Table 2-16, an average of 905 permits granted annually. This figure<br />
includes not only new construction but additions to existing residential structures. The year with<br />
the most permits granted was 1999 with 1,050 permits granted followed closely by 1990 with<br />
1,011 total permits. While zoning permit activity has fluctuated over the analysis period, the<br />
number of permits granted has never varied from this average by more than 12.5 percent over<br />
the analysis period.<br />
Table 2-16. Zoning Permits Issued, <strong>Stanly</strong> <strong>County</strong>, 1990-2001.<br />
Commercial/<br />
Industrial<br />
Total Residential/<br />
Commercial/<br />
Year<br />
Residential<br />
Permits<br />
Permits Industrial Permits<br />
1990 — — — 1,011<br />
1991 — — — 880<br />
1992 — — — 898<br />
1993 — — — 856<br />
1994 — — — 794<br />
1995 — — — 795<br />
1996 — — — 834<br />
1997 — — — 919<br />
1998 492 31 523 945<br />
1999 510 54 564 1,050<br />
2000 481 24 505 979<br />
2001 480 82 562 905<br />
Total 1,963 191 2,154 10,866<br />
Average 490.8 47.8 538.5 905.0<br />
Source: <strong>Stanly</strong> <strong>County</strong> Permit Activity Reports, <strong>Stanly</strong> <strong>County</strong> <strong>Plan</strong>ning and Zoning Department,<br />
1990-2001.<br />
Total Permits<br />
(Includes Additions)<br />
A more-detailed breakdown of zoning permit information is provided for the time period<br />
beginning in 1998. This breakdown—while not providing an adequate length of time to establish<br />
a clear trend—indicates an average of 490.8 residential zoning permits and 47.8 commercial<br />
and industrial permits granted annually. The figures for residential permits has been fairly<br />
consistent over the three-year period, ranging from a low 492 permits in 1998 to a high of 510<br />
permits in 1999. Figures for commercial and industrial zoning permits is less consistent, ranging<br />
from a low of 24 in 2000 and a high of 82 in 2001.<br />
Building Permits<br />
Table 2-17 provides a summary of building permits issued from 1997 through 2001 for all of<br />
<strong>Stanly</strong> <strong>County</strong> including all incorporated areas. The statistics indicated in Table 2-17 do not<br />
provide an adequate amount of historical data to indicate a clear trend, but they do indicate<br />
some interesting findings. First, new home building permits issued in <strong>Stanly</strong> <strong>County</strong> have<br />
averaged 273 permits issued annually with high and low yearly figures within 10 percent of the<br />
average. Trends for the issuance of permits for manufactured homes—although more erratic<br />
than statistics on new home construction—are generally consistent from year to year. An<br />
average of 278 manufactured home permits have been issued since 1997 in <strong>Stanly</strong> <strong>County</strong>.<br />
<strong>Land</strong> <strong>Use</strong> <strong>Plan</strong> 2-11 6/02