JPMORGAN CHASE WHALE TRADES: A CASE HISTORY OF DERIVATIVES RISKS AND ABUSES
JPMORGAN CHASE WHALE TRADES: A CASE HISTORY OF DERIVATIVES RISKS AND ABUSES
JPMORGAN CHASE WHALE TRADES: A CASE HISTORY OF DERIVATIVES RISKS AND ABUSES

You also want an ePaper? Increase the reach of your titles
YUMPU automatically turns print PDFs into web optimized ePapers that Google loves.
111<br />
Evidence indicates that the CIO personnel in London responsible for reporting the SCP<br />
marks were fully aware that they were misusing the valuation process to understate the SCP<br />
losses. As the discrepancy in the marks grew, the two key CIO traders recording the marks<br />
became increasingly agitated.<br />
In mid-March, the junior CIO trader charged with reporting the daily value of the SCP<br />
book, Julien Grout, began keeping a spreadsheet tracking the difference between what he was<br />
reporting to the bank using the more favorable values versus what he would have reported using<br />
the midpoint prices. 669<br />
For five days, he tracked the divergence for three of the largest credit<br />
derivative holdings in the SCP book, the “CDX.IG” credit index referencing credit default swaps<br />
for U.S. investment grade companies, the “iTraxx Main” index which is the European equivalent<br />
of the IG index, and the “CDX.HY,” or High Yield credit index, which referenced credit default<br />
swaps for below investment grade companies.<br />
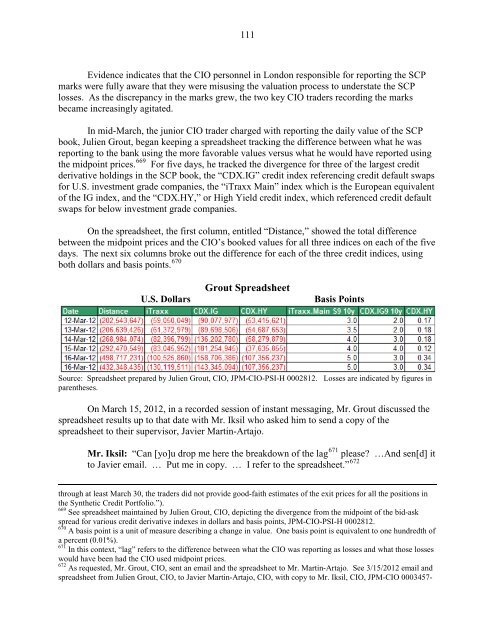
On the spreadsheet, the first column, entitled “Distance,” showed the total difference<br />
between the midpoint prices and the CIO’s booked values for all three indices on each of the five<br />
days. The next six columns broke out the difference for each of the three credit indices, using<br />
both dollars and basis points. 670<br />
Grout Spreadsheet<br />
U.S. Dollars Basis Points<br />
Source: Spreadsheet prepared by Julien Grout, CIO, JPM-CIO-PSI-H 0002812. Losses are indicated by figures in<br />
parentheses.<br />
On March 15, 2012, in a recorded session of instant messaging, Mr. Grout discussed the<br />
spreadsheet results up to that date with Mr. Iksil who asked him to send a copy of the<br />
spreadsheet to their supervisor, Javier Martin-Artajo.<br />
Mr. Iksil: “Can [yo]u drop me here the breakdown of the lag 671 please? …And sen[d] it<br />
to Javier email. … Put me in copy. … I refer to the spreadsheet.” 672<br />
through at least March 30, the traders did not provide good-faith estimates of the exit prices for all the positions in<br />
the Synthetic Credit Portfolio.”).<br />
669<br />
See spreadsheet maintained by Julien Grout, CIO, depicting the divergence from the midpoint of the bid-ask<br />
spread for various credit derivative indexes in dollars and basis points, JPM-CIO-PSI-H 0002812.<br />
670<br />
A basis point is a unit of measure describing a change in value. One basis point is equivalent to one hundredth of<br />
a percent (0.01%).<br />
671<br />
In this context, “lag” refers to the difference between what the CIO was reporting as losses and what those losses<br />
would have been had the CIO used midpoint prices.<br />
672<br />
As requested, Mr. Grout, CIO, sent an email and the spreadsheet to Mr. Martin-Artajo. See 3/15/2012 email and<br />
spreadsheet from Julien Grout, CIO, to Javier Martin-Artajo, CIO, with copy to Mr. Iksil, CIO, JPM-CIO 0003457-