Soil Report - Agriculture et Agroalimentaire Canada
Soil Report - Agriculture et Agroalimentaire Canada
Soil Report - Agriculture et Agroalimentaire Canada

You also want an ePaper? Increase the reach of your titles
YUMPU automatically turns print PDFs into web optimized ePapers that Google loves.
<strong>Soil</strong> Mapping<br />
First, a legend was developed by compiling information<br />
from existing resource publications such as geological<br />
reports, conservation area reports, old soil maps, <strong>et</strong>c ., and<br />
combining this with preliminary field observations .<br />
Next, with the aid ofa stereoscope, tentative soil boundaries<br />
were drawn on the most recent aerial photographs (scale<br />
1:15 840) . With the legend as a guide, these soil boundaries<br />
and the soils were checked in the field .<br />
Field checking of the soils was done along all public<br />
roads, where the soil was periodically examined, especially<br />
where stereoscopic investigations had indicated major changes .<br />
<strong>Soil</strong>s were checked in fields, woodlots, and undisturbed<br />
road allowances . Most sites were close to roads, but<br />
occasionally it was necessary to traverse some distance into<br />
concessions to verify soil boundaries .<br />
<strong>Soil</strong> probes and Dutch augers were the tools most commonly<br />
used to investigate soils . <strong>Soil</strong>s were usually checked and<br />
described to a depth of 1 m. Shovels were used occasionally<br />
to dig pits and scrape down exposures along roads, ditches<br />
and streams. <strong>Soil</strong> samples were periodically collected for<br />
laboratory analyses, to verify or supplement field observations .<br />
B<strong>et</strong>ween 5 and 10% of all sites were sampled for this<br />
purpose .<br />
The next operation was to compile the field and laboratory<br />
information in the office onto 1 :25 000 scale topographic<br />
base maps . Maps compiled in this way were published the<br />
year following the field mapping as preliminary soil maps .<br />
The last step was to prepare the final maps . This was done<br />
by changing the map unit designations on the preliminary<br />
maps to the final unique symbols, and by making any<br />
necessary boundary changes . These final maps were prepared<br />
for publication and entered into a computerized data file, by<br />
the Cartography Section of the Land Resource Research<br />
Institute, <strong>Agriculture</strong> <strong>Canada</strong>, Ottawa.<br />
Survey Intensity and Map Reliability<br />
The survey intensity level provides an idea of the precision<br />
with which the soil survey was done . Survey intensity level l<br />
indicates the precision of d<strong>et</strong>ailed, large scale surveys, e.g .<br />
1 :10 000 ; survey intensity level 5 indicates the precision of<br />
small scale surveys, e.g . 1 :250 000 (20) . The survey intensity<br />
level ofthe Haldimand-Norfolk soil survey is at an intermediate<br />
level, b<strong>et</strong>ween levels 2 and 3 .<br />
In this survey there was at least one soil inspection in most<br />
map delineations ; boundaries of delineations were checked<br />
at intervals in the field but mainly extrapolated from air<br />
photos. The numberof inspections per cmz on the Haldimand-<br />
Norfolk soil maps was about 0.2 or about one inspection per<br />
29 ha (72 ac) .<br />
<strong>Soil</strong> inspections were done by examinations of vertical<br />
soil sections by probe, auger or shovel . Average depth of<br />
examination was to about 1 m. <strong>Soil</strong>s were occasionally<br />
examined to the 1 to 2 m depth, usually at sites of deep<br />
roadcuts or bank cuts .<br />
Considering the survey intensity level and scale of the<br />
Haldimand-Norfolk soil maps, the most appropriate uses for<br />
these maps are for planning purposes of land areas such as<br />
townships, small conservation areas, large urban subdivisions,<br />
HOW THE SOILS WERE<br />
MAPPED AND CLASSIFIED<br />
25<br />
or large farms . The suitability of the maps for uses of smaller<br />
areas such as small farms, small subdivisions, building sites,<br />
<strong>et</strong>c ., is less appropriate, because the average area covered<br />
by map delineations of the Haldimand-Norfolk soil maps, is<br />
about 33 ha (83 ac) .<br />
<strong>Soil</strong> Classification<br />
<strong>Soil</strong>s of the Haldimand-Norfolk Region have developed in<br />
soil parent materials ranging in texture from heavy clays to<br />
coarse gravels . Most soil differences are related to these<br />
textural differences . Variations in drainage also cause<br />
differences b<strong>et</strong>ween soils developed on the same soil parent<br />
materials . Other soil forming factors, such as topography,<br />
time, climate and veg<strong>et</strong>ation, have also contributed to soil<br />
differences .<br />
Most of the soil parent materials in the Haldimand-<br />
Norfolk Region are highly calcareous and alkaline . However,<br />
the soils developed on such materials are less calcareous<br />
because of the leaching action of water on soil bases,<br />
especially calcium. This leaching action, along with associated<br />
soil weathering, causes the development of soil horizons<br />
near the soil surface . These horizons differ from each other<br />
in properties such as texture, color, thickness, structure and<br />
consistence .<br />
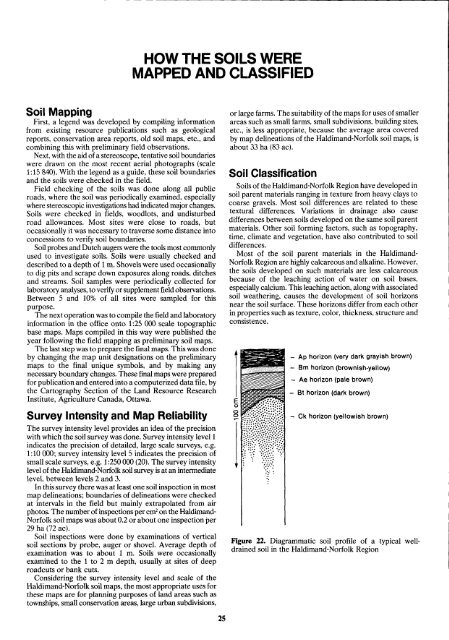
- Ap horizon (very dark grayish brown)<br />
- Bm horizon (brownish-yellow)<br />
- Ae horizon (pale brown)<br />
- Bt horizon (dark brown)<br />
- Ck horizon (yellowish brown)<br />
Figure 22 . Diagrammatic soil profile of a typical welldrained<br />
soil in the Haldimand-Norfolk Region