Soil Report - Agriculture et Agroalimentaire Canada
Soil Report - Agriculture et Agroalimentaire Canada
Soil Report - Agriculture et Agroalimentaire Canada

Create successful ePaper yourself
Turn your PDF publications into a flip-book with our unique Google optimized e-Paper software.
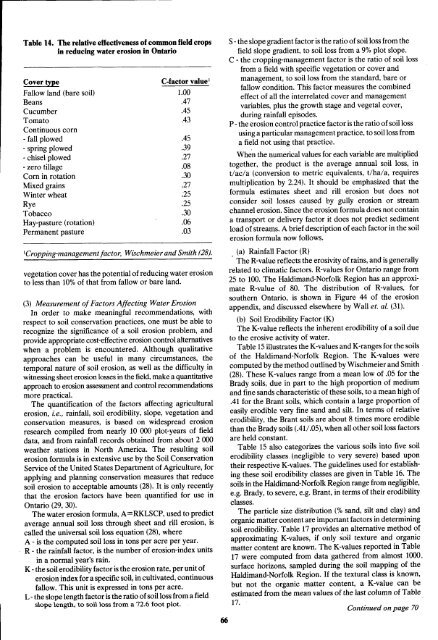
Table 14 . The relative effectiveness of common field crops<br />
in reducing water erosion in Ontario<br />
Cover type C-factor value'<br />
Fallow land (bare soil) 1.00<br />
Beans .47<br />
Cucumber .45<br />
Tomato .43<br />
Continuous corn<br />
- fall plowed .45<br />
- spring plowed .39<br />
- chisel plowed .27<br />
- zero tillage .08<br />
Corn in rotation .30<br />
Mixed grains .27<br />
Winter wheat .25<br />
Rye .25<br />
Tobacco .30<br />
Hay-pasture (rotation) .06<br />
Permanent pasture .03<br />
'Cropping-managementfactor, Wischmeierand Smith (28).<br />
veg<strong>et</strong>ation cover has the potential of reducing water erosion<br />
to less than 10% of that from fallow or bare land .<br />
(3) Measurement ofFactors Affecting Water Erosion<br />
In order to make meaningful recommendations, with<br />
respect to soil conservation practices, one must be able to<br />
recognize the significance of a soil erosion problem, and<br />
provide appropriate cost-effective erosion control alternatives<br />
when a problem is encountered . Although qualitative<br />
approaches can be useful in many circumstances, the<br />
temporal nature of soil erosion, as well as the difficulty in<br />
witnessing she<strong>et</strong> erosion losses in the field, make a quantitative<br />
approach to erosion assessment and control recommendations<br />
more practical .<br />
The quantification of the factors affecting agricultural<br />
erosion, i.e ., rainfall, soil erodibility, slope, veg<strong>et</strong>ation and<br />
conservation measures, is based on widespread erosion<br />
research compiled from nearly 10 000 plot-years of field<br />
data, and from rainfall records obtained from about 2 000<br />
weather stations in North America . The resulting soil<br />
erosion formula is in extensive use by the <strong>Soil</strong> Conservation<br />
Service of the United States Department of <strong>Agriculture</strong>, for<br />
applying and planning conservation measures that reduce<br />
soil erosion to acceptable amounts (28) . It is only recently<br />
that the erosion factors have been quantified for use in<br />
Ontario (29, 30) .<br />
The water erosion formula, A=RKLSCP, used to predict<br />
average annual soil loss through she<strong>et</strong> and rill erosion, is<br />
called the universal soil loss equation (28), where<br />
A - is the computed soil loss in tons per acre per year .<br />
R - the rainfall factor, is the number of erosion-index units<br />
in a normal year's rain .<br />
K - the soil erodibility factor is the erosion rate, per unit of<br />
erosion index for a specific soil, in cultivated, continuous<br />
fallow . This unit is expressed in tons per acre.<br />
L - the slope length factor is the ratio of soilloss from a field<br />
slope length, to soil loss from a 72 .6 foot plot .<br />
S - the slope gradient factor is the ratio of soil loss from the<br />
field slope gradient, to soil loss from a 9% plot slope .<br />
C - the cropping-management factor is the ratio of soil loss<br />
from a field with specific veg<strong>et</strong>ation or cover and<br />
management, to soil loss from the standard, bare or<br />
fallow condition . This factor measures the combined<br />
effect of all the interrelated cover and management<br />
variables, plus the growth stage and veg<strong>et</strong>al cover,<br />
during rainfall episodes .<br />
P - the erosion control practice factor is the ratio of soil loss<br />
using a particular management practice, to soil loss from<br />
a field not using that practice .<br />
When the numerical values for each variable are multiplied<br />
tog<strong>et</strong>her, the product is the average annual soil loss, in<br />
t/ac/a (conversion to m<strong>et</strong>ric equivalents, t/ha/a, requires<br />
multiplication by 2 .24) . It should be emphasized that the<br />
formula estimates she<strong>et</strong> and rill erosion but does not<br />
consider soil losses caused by gully erosion or stream<br />
channel erosion . Since the erosion formula does not contain<br />
a transport or delivery factor it does not predict sediment<br />
load of streams . A brief description of each factor in the soil<br />
erosion formula now follows.<br />
(a) Rainfall Factor (R)<br />
The R-value reflects the erosivity of rains, and is generally<br />
related to climatic factors . R-values for Ontario range from<br />
25 to 100 . The Haldimand-Norfolk Region has an approximate<br />
R-value of 80 . The distribution of R-values, for<br />
southern Ontario, is shown in Figure 44 of the erosion<br />
appendix, and discussed elsewhere by Wall <strong>et</strong>. al. (31) .<br />
(b) <strong>Soil</strong> Erodibility Factor (K)<br />
The K-value reflects the inherent erodibility of a soil due<br />
to the erosive activity of water .<br />
Table 15 illustrates the K-values and K-ranges for the soils<br />
of the Haldimand-Norfolk Region . The K-values were<br />
computed by the m<strong>et</strong>hod outlined by Wischmeier and Smith<br />
(28) . These K-values range from a mean low of .05 for the<br />
Brady soils, due in part to the high proportion of medium<br />
and fine sands characteristic of these soils, to a mean high of<br />
.41 for the Brant soils, which contain a large proportion of<br />
easily erodible very fine sand and silt . In terms of relative<br />
erodibility, the Brant soils are about 8 times more erodible<br />
than the Brady soils (.41/.05), when all other soil loss factors<br />
are held cpnstant .<br />
Table 15 also categorizes the various soils into five soil<br />
erodibility classes . (negligible to very severe) based upon<br />
their respective K-values . The guidelines used for establishing<br />
these soil erodibility classes are given in Table 16 . The<br />
soils in the Haldimand-Norfolk Region range from negligible,<br />
e .g . Brady, to severe, e .g. Brant, in terms of their erodibility<br />
classes.<br />
The particle size distribution (% sand, silt and clay) and<br />
organic matter content are important factors in d<strong>et</strong>ermining<br />
soil erodibility . Table 17 provides an alternative m<strong>et</strong>hod of<br />
approximating K-values, if only soil texture and organic<br />
matter content are known. The K-values reported in Table<br />
17 were computed from data gathered from almost 1000 .<br />
surface horizons, sampled during the soil mapping of the<br />
Haldimand-Norfolk Region . If the textural class is known,<br />
but not the organic matter content, a K-value can be<br />
estimated from the mean values of the last column of Table<br />
17.<br />
Continued on page 70