Statistical Language Models based on Neural Networks - Faculty of ...
Statistical Language Models based on Neural Networks - Faculty of ...
Statistical Language Models based on Neural Networks - Faculty of ...

Create successful ePaper yourself
Turn your PDF publications into a flip-book with our unique Google optimized e-Paper software.
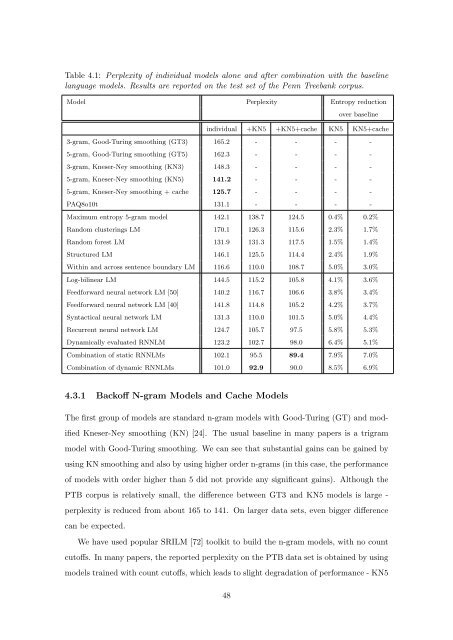
Table 4.1: Perplexity <strong>of</strong> individual models al<strong>on</strong>e and after combinati<strong>on</strong> with the baseline<br />
language models. Results are reported <strong>on</strong> the test set <strong>of</strong> the Penn Treebank corpus.<br />
Model Perplexity Entropy reducti<strong>on</strong><br />
over baseline<br />
individual +KN5 +KN5+cache KN5 KN5+cache<br />
3-gram, Good-Turing smoothing (GT3) 165.2 - - - -<br />
5-gram, Good-Turing smoothing (GT5) 162.3 - - - -<br />
3-gram, Kneser-Ney smoothing (KN3) 148.3 - - - -<br />
5-gram, Kneser-Ney smoothing (KN5) 141.2 - - - -<br />
5-gram, Kneser-Ney smoothing + cache 125.7 - - - -<br />
PAQ8o10t 131.1 - - - -<br />
Maximum entropy 5-gram model 142.1 138.7 124.5 0.4% 0.2%<br />
Random clusterings LM 170.1 126.3 115.6 2.3% 1.7%<br />
Random forest LM 131.9 131.3 117.5 1.5% 1.4%<br />
Structured LM 146.1 125.5 114.4 2.4% 1.9%<br />
Within and across sentence boundary LM 116.6 110.0 108.7 5.0% 3.0%<br />
Log-bilinear LM 144.5 115.2 105.8 4.1% 3.6%<br />
Feedforward neural network LM [50] 140.2 116.7 106.6 3.8% 3.4%<br />
Feedforward neural network LM [40] 141.8 114.8 105.2 4.2% 3.7%<br />
Syntactical neural network LM 131.3 110.0 101.5 5.0% 4.4%<br />
Recurrent neural network LM 124.7 105.7 97.5 5.8% 5.3%<br />
Dynamically evaluated RNNLM 123.2 102.7 98.0 6.4% 5.1%<br />
Combinati<strong>on</strong> <strong>of</strong> static RNNLMs 102.1 95.5 89.4 7.9% 7.0%<br />
Combinati<strong>on</strong> <strong>of</strong> dynamic RNNLMs 101.0 92.9 90.0 8.5% 6.9%<br />
4.3.1 Back<strong>of</strong>f N-gram <str<strong>on</strong>g>Models</str<strong>on</strong>g> and Cache <str<strong>on</strong>g>Models</str<strong>on</strong>g><br />
The first group <strong>of</strong> models are standard n-gram models with Good-Turing (GT) and mod-<br />
ified Kneser-Ney smoothing (KN) [24]. The usual baseline in many papers is a trigram<br />
model with Good-Turing smoothing. We can see that substantial gains can be gained by<br />
using KN smoothing and also by using higher order n-grams (in this case, the performance<br />
<strong>of</strong> models with order higher than 5 did not provide any significant gains). Although the<br />
PTB corpus is relatively small, the difference between GT3 and KN5 models is large -<br />
perplexity is reduced from about 165 to 141. On larger data sets, even bigger difference<br />
can be expected.<br />
We have used popular SRILM [72] toolkit to build the n-gram models, with no count<br />
cut<strong>of</strong>fs. In many papers, the reported perplexity <strong>on</strong> the PTB data set is obtained by using<br />
models trained with count cut<strong>of</strong>fs, which leads to slight degradati<strong>on</strong> <strong>of</strong> performance - KN5<br />
48