


You also want an ePaper? Increase the reach of your titles
YUMPU automatically turns print PDFs into web optimized ePapers that Google loves.
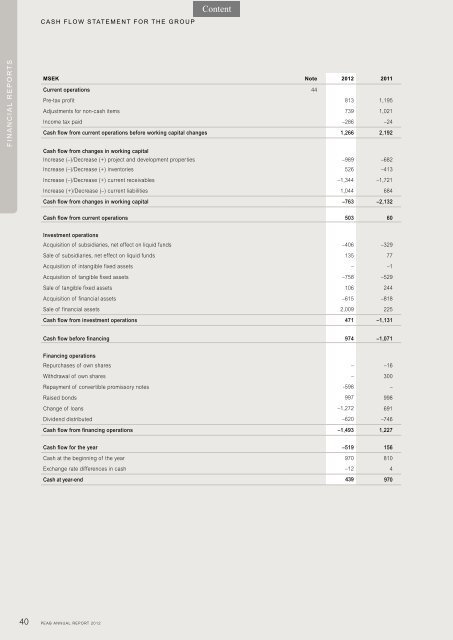
FINANCIAL REPORTS<br />
CASH FLOW STATEMENT FOR THE GROUP<br />
MSEK Note <strong>2012</strong> 2011<br />
Current operations 44<br />
Pre-tax profit 813 1,195<br />
Adjustments for non-cash items 739 1,021<br />
Income tax paid –286 –24<br />
Cash flow from current operations before working capital changes 1,266 2,192<br />
Cash flow from changes in working capital<br />
Increase (–)/Decrease (+) project and development properties –989 –682<br />
Increase (–)/Decrease (+) inventories 526 –413<br />
Increase (–)/Decrease (+) current receivables –1,344 –1,721<br />
Increase (+)/Decrease (–) current liabilities 1,044 684<br />
Cash flow from changes in working capital –763 –2,132<br />
Cash flow from current operations 503 60<br />
Investment operations<br />
Acquisition of subsidiaries, net effect on liquid funds –406 –329<br />
Sale of subsidiaries, net effect on liquid funds 135 77<br />
Acquisition of intangible fixed assets – –1<br />
Acquisition of tangible fixed assets –758 –529<br />
Sale of tangible fixed assets 106 244<br />
Acquisition of financial assets –615 –818<br />
Sale of financial assets 2,009 225<br />
Cash flow from investment operations 471 –1,131<br />
Cash flow before financing 974 –1,071<br />
Financing operations<br />
Repurchases of own shares – –16<br />
Withdrawal of own shares – 300<br />
Repayment of convertible promissory notes -598 –<br />
Raised bonds 997 998<br />
Change of loans –1,272 691<br />
Dividend distributed –620 –746<br />
Cash flow from financing operations –1,493 1,227<br />
Cash flow for the year –519 156<br />
Cash at the beginning of the year 970 810<br />
Exchange rate differences in cash –12 4<br />
Cash at year-end 439 970<br />
40 PEAB ANNUAL REPORT <strong>2012</strong>