


Create successful ePaper yourself
Turn your PDF publications into a flip-book with our unique Google optimized e-Paper software.
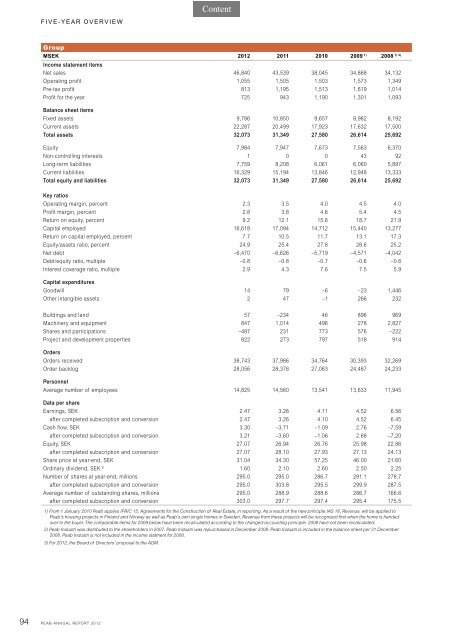
FIVE-YEAR OVERVIEW<br />
Group<br />
MSEK <strong>2012</strong> 2011 2010 2009 1) 1) 2) 2008<br />
Income statement items<br />
Net sales 46,840 43,539 38,045 34,868 34,132<br />
Operating profit 1,055 1,505 1,503 1,573 1,349<br />
Pre-tax profit 813 1,195 1,513 1,619 1,014<br />
Profit for the year 725 943 1,190 1,301 1,093<br />
Balance sheet items<br />
Fixed assets 9,786 10,850 9,657 8,982 8,192<br />
Current assets 22,287 20,499 17,923 17,632 17,500<br />
Total assets 32,073 31,349 27,580 26,614 25,692<br />
Equity 7,984 7,947 7,673 7,563 6,370<br />
Non-controlling interests 1 0 0 43 92<br />
Long-term liabilities 7,759 8,208 6,061 6,060 5,897<br />
Current liabilities 16,329 15,194 13,846 12,948 13,333<br />
Total equity and liabilities 32,073 31,349 27,580 26,614 25,692<br />
Key ratios<br />
Operating margin, percent 2.3 3.5 4.0 4.5 4.0<br />
Profit margin, percent 2.8 3.8 4.6 5.4 4.5<br />
Return on equity, percent 9.2 12.1 15.6 18.7 21.9<br />
Capital employed 16,618 17,094 14,712 15,440 13,277<br />
Return on capital employed, percent 7.7 10.5 11.7 13.1 17.3<br />
Equity/assets ratio, percent 24.9 25.4 27.8 28.6 25.2<br />
Net debt –6,470 –6,626 –5,719 –4,571 –4,042<br />
Debt/equity ratio, multiple –0.8 –0.8 –0.7 –0.6 –0.6<br />
Interest coverage ratio, multiple 2.9 4.3 7.6 7.5 5.9<br />
Capital expenditures<br />
Goodwill 14 79 –6 –23 1,446<br />
Other intangible assets 2 47 –1 266 232<br />
Buildings and land 57 –234 46 896 969<br />
Machinery and equipment 847 1,014 496 278 2,827<br />
Shares and participations –487 231 773 576 –222<br />
Project and development properties 822 273 797 518 914<br />
Orders<br />
Orders received 38,743 37,986 34,764 30,393 32,269<br />
Order backlog 28,056 28,378 27,063 24,487 24,233<br />
Personnel<br />
Average number of employees 14,825 14,560 13,541 13,633 11,945<br />
Data per share<br />
Earnings, SEK 2.47 3.26 4.11 4.52 6.56<br />
after completed subscription and conversion 2.47 3.26 4.10 4.52 6.45<br />
Cash flow, SEK 3.30 –3.71 –1.09 2.76 –7,59<br />
after completed subscription and conversion 3.21 –3.60 –1.06 2.68 –7,20<br />
Equity, SEK 27.07 26.94 26.76 25.98 22.86<br />
after completed subscription and conversion 27.07 28.10 27.93 27.13 24.13<br />
Share price at year-end, SEK 31.04 34.30 57.25 46.00 21.60<br />
Ordinary dividend, SEK 3) 1.60 2.10 2.60 2.50 2.25<br />
Number of shares at year-end, millions 295.0 295.0 286.7 291.1 278.7<br />
after completed subscription and conversion 295.0 303.8 295.5 299.9 287.5<br />
Average number of outstanding shares, millions 295.0 288.9 288.6 286.7 166.6<br />
after completed subscription and conversion 303.0 297.7 297.4 295.4 175.5<br />
1) From 1 January 2010 <strong>Peab</strong> applies IFRIC 15, Agreements for the Construction of Real Estate, in <strong>report</strong>ing. As a result of the new principle IAS 18, Revenue, will be applied to<br />
<strong>Peab</strong>’s housing projects in Finland and Norway as well as <strong>Peab</strong>’s own single homes in Sweden. Revenue from these projects will be recognized first when the home is handed<br />
over to the buyer. The comparable items for 2009 below have been recalculated according to the changed accounting principle. 2008 have not been recalculated.<br />
2) <strong>Peab</strong> Industri was distributed to the shareholders in 2007. <strong>Peab</strong> Industri was repurchased in December 2008. <strong>Peab</strong> Industri is included in the balance sheet per 31 December<br />
2008. <strong>Peab</strong> Industri is not included in the income statment for 2008.<br />
3) For <strong>2012</strong>, the Board of Directors’ proposal to the AGM.<br />
94 PEAB ANNUAL REPORT <strong>2012</strong>