


You also want an ePaper? Increase the reach of your titles
YUMPU automatically turns print PDFs into web optimized ePapers that Google loves.
NOTES<br />
1<br />
2<br />
3<br />
4<br />
5<br />
6<br />
7<br />
8<br />
9<br />
10<br />
11<br />
12<br />
13<br />
14<br />
15<br />
16<br />
17<br />
18<br />
19<br />
20<br />
21<br />
22<br />
23<br />
24<br />
25<br />
26<br />
27<br />
28<br />
29<br />
30<br />
31<br />
32<br />
33<br />
34<br />
35<br />
36<br />
37<br />
38<br />
39<br />
40<br />
41<br />
42<br />
43<br />
44<br />
45<br />
46<br />
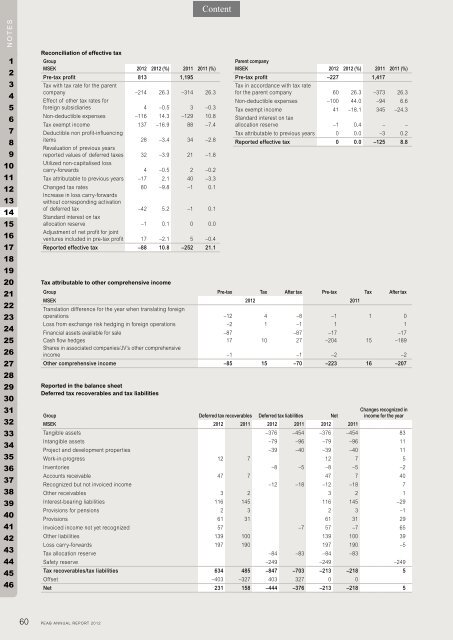
Reconciliation of effective tax<br />
Group<br />
MSEK <strong>2012</strong> <strong>2012</strong> (%) 2011 2011 (%)<br />
Pretax profit<br />
Tax with tax rate for the parent<br />
813 1,195<br />
company<br />
Effect of other tax rates for<br />
–214 26.3 –314 26.3<br />
foreign subsidiaries 4 –0.5 3 –0.3<br />
Non-deductible expenses –116 14.3 –129 10.8<br />
Tax exempt income<br />
Deductible non profit-influencing<br />
137 –16.9 88 –7.4<br />
items<br />
Revaluation of previous years<br />
28 –3.4 34 –2.8<br />
<strong>report</strong>ed values of deferred taxes<br />
Utilized non-capitalised loss<br />
32 –3.9 21 –1.8<br />
carry-forwards 4 –0.5 2 –0.2<br />
Tax attributable to previous years –17 2.1 40 –3.3<br />
Changed tax rates<br />
Increase in loss carry-forwards<br />
without corresponding activation<br />
80 –9.8 –1 0.1<br />
of deferred tax<br />
Standard interest on tax<br />
–42 5.2 –1 0.1<br />
allocation reserve<br />
Adjustment of net profit for joint<br />
–1 0.1 0 0.0<br />
ventures included in pre-tax profit 17 –2.1 5 –0.4<br />
Reported effective tax –88 10.8 –252 21.1<br />
Tax attributable to other comprehensive income<br />
Group Pretax Tax After tax Pretax Tax After tax<br />
MSEK <strong>2012</strong> 2011<br />
Translation difference for the year when translating foreign<br />
operations –12 4 –8 –1 1 0<br />
Loss from exchange risk hedging in foreign operations –2 1 –1 1 1<br />
Financial assets available for sale –87 –87 –17 –17<br />
Cash flow hedges<br />
Shares in associated companies/JV’s other comprehensive<br />
17 10 27 –204 15 –189<br />
income –1 –1 –2 –2<br />
Other comprehensive income –85 15 –70 –223 16 –207<br />
Reported in the balance sheet<br />
Deferred tax recoverables and tax liabilities<br />
Parent company<br />
MSEK <strong>2012</strong> <strong>2012</strong> (%) 2011 2011 (%)<br />
Pretax profit<br />
Tax in accordance with tax rate<br />
–227 1,417<br />
for the parent company 60 26.3 –373 26.3<br />
Non-deductible expenses –100 44.0 –94 6.6<br />
Tax exempt income<br />
Standard interest on tax<br />
41 –18.1 345 –24.3<br />
allocation reserve –1 0.4 – –<br />
Tax attributable to previous years 0 0.0 –3 0.2<br />
Reported effective tax 0 0.0 –125 8.8<br />
Group Deferred tax recoverables Deferred tax liabilities Net<br />
Changes recognized in<br />
income for the year<br />
MSEK <strong>2012</strong> 2011 <strong>2012</strong> 2011 <strong>2012</strong> 2011<br />
Tangible assets –376 –454 –376 –454 83<br />
Intangible assets –79 –96 –79 –96 11<br />
Project and development properties –39 –40 –39 –40 11<br />
Work-in-progress 12 7 12 7 5<br />
Inventories –8 –5 –8 –5 –2<br />
Accounts receivable 47 7 47 7 40<br />
Recognized but not invoiced income –12 –18 –12 –18 7<br />
Other receivables 3 2 3 2 1<br />
Interest-bearing liabilities 116 145 116 145 –29<br />
Provisions for pensions 2 3 2 3 –1<br />
Provisions 61 31 61 31 29<br />
Invoiced income not yet recognized 57 –7 57 –7 65<br />
Other liabilities 139 100 139 100 39<br />
Loss carry-forwards 197 190 197 190 –5<br />
Tax allocation reserve –84 –83 –84 –83<br />
Safety reserve –249 –249 –249<br />
Tax recoverables/tax liabilities 634 485 –847 –703 –213 –218 5<br />
Offset –403 –327 403 327 0 0<br />
Net 231 158 –444 –376 –213 –218 5<br />
60 PEAB ANNUAL REPORT <strong>2012</strong>