


You also want an ePaper? Increase the reach of your titles
YUMPU automatically turns print PDFs into web optimized ePapers that Google loves.
NOTES<br />
1<br />
2<br />
3<br />
4<br />
5<br />
6<br />
7<br />
8<br />
9<br />
10<br />
11<br />
12<br />
13<br />
14<br />
15<br />
16<br />
17<br />
18<br />
19<br />
20<br />
21<br />
22<br />
23<br />
24<br />
25<br />
26<br />
27<br />
28<br />
29<br />
30<br />
31<br />
32<br />
33<br />
34<br />
35<br />
36<br />
37<br />
38<br />
39<br />
40<br />
41<br />
42<br />
43<br />
44<br />
45<br />
46<br />
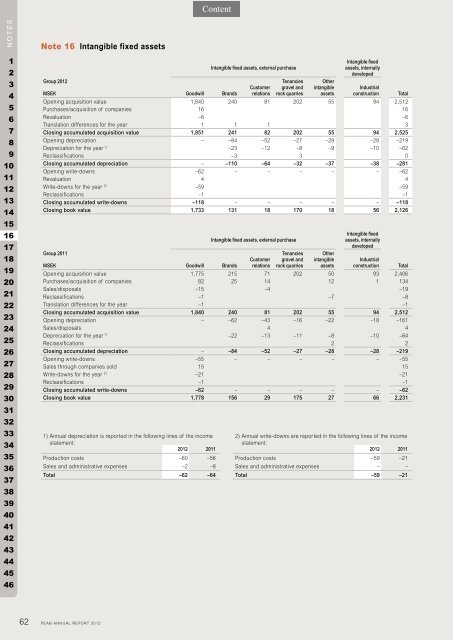
Note 16 Intangible fixed assets<br />
Group <strong>2012</strong><br />
MSEK Goodwill Brands<br />
1) <strong>Annual</strong> depreciation is <strong>report</strong>ed in the following lines of the income<br />
statement:<br />
<strong>2012</strong> 2011<br />
Production costs –60 –56<br />
Sales and administrative expenses –2 –8<br />
Total –62 –64<br />
Intangible fixed assets, external purchase<br />
Customer<br />
relations<br />
Tenancies<br />
gravel and<br />
rock quarries<br />
Other<br />
intangible<br />
assets<br />
Intangible fixed<br />
assets, internally<br />
developed<br />
Industrial<br />
construction Total<br />
Opening acquisition value 1,840 240 81 202 55 94 2,512<br />
Purchases/acquisition of companies 16 16<br />
Revaluation –6 –6<br />
Translation differences for the year 1 1 1 3<br />
Closing accumulated acquisition value 1,851 241 82 202 55 94 2,525<br />
Opening depreciation – –84 –52 –27 –28 –28 –219<br />
Depreciation for the year 1) –23 –12 –8 –9 –10 –62<br />
Reclassifications –3 3 0<br />
Closing accumulated depreciation – –110 –64 –32 –37 –38 –281<br />
Opening write-downs –62 – – – – – –62<br />
Revaluation 4 4<br />
Write-downs for the year 2) –59 –59<br />
Reclassifications –1 –1<br />
Closing accumulated write-downs –118 – – – – – –118<br />
Closing book value 1,733 131 18 170 18 56 2,126<br />
Group 2011<br />
MSEK Goodwill Brands<br />
Intangible fixed assets, external purchase<br />
Customer<br />
relations<br />
Tenancies<br />
gravel and<br />
rock quarries<br />
Other<br />
intangible<br />
assets<br />
Intangible fixed<br />
assets, internally<br />
developed<br />
Industrial<br />
construction Total<br />
Opening acquisition value 1,775 215 71 202 50 93 2,406<br />
Purchases/acquisition of companies 82 25 14 12 1 134<br />
Sales/disposals –15 –4 –19<br />
Reclassifications –1 –7 –8<br />
Translation differences for the year –1 –1<br />
Closing accumulated acquisition value 1,840 240 81 202 55 94 2,512<br />
Opening depreciation – –62 –43 –16 –22 –18 –161<br />
Sales/disposals 4 4<br />
Depreciation for the year 1) –22 –13 –11 –8 –10 –64<br />
Reclassifications 2 2<br />
Closing accumulated depreciation – –84 –52 –27 –28 –28 –219<br />
Opening write-downs –55 – – – – – –55<br />
Sales through companies sold 15 15<br />
Write-downs for the year 2) –21 –21<br />
Reclassifications –1 –1<br />
Closing accumulated write-downs –62 – – – – – –62<br />
Closing book value 1,778 156 29 175 27 66 2,231<br />
62 PEAB ANNUAL REPORT <strong>2012</strong><br />
2) <strong>Annual</strong> write-downs are <strong>report</strong>ed in the following lines of the income<br />
statement:<br />
<strong>2012</strong> 2011<br />
Production costs –59 –21<br />
Sales and administrative expenses – –<br />
Total –59 –21