


Create successful ePaper yourself
Turn your PDF publications into a flip-book with our unique Google optimized e-Paper software.
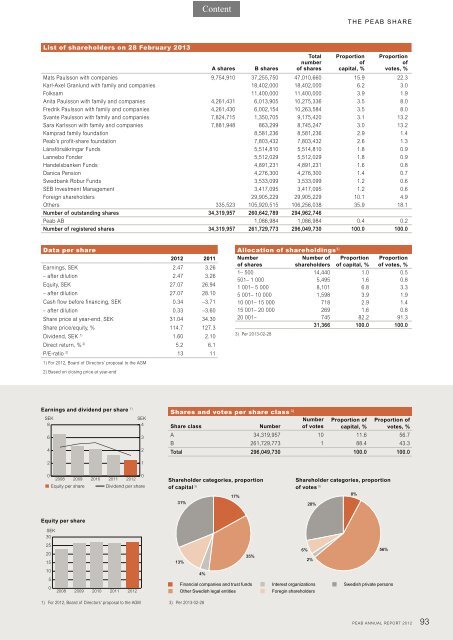
List of shareholders on 28 February 2013<br />
A shares B shares<br />
Total<br />
number<br />
of shares<br />
THE PEAB SHARE<br />
Proportion<br />
of<br />
capital, %<br />
Proportion<br />
of<br />
votes, %<br />
Mats Paulsson with companies 9,754,910 37,255,750 47,010,660 15.9 22.3<br />
Karl-Axel Granlund with family and companies 18,402,000 18,402,000 6.2 3.0<br />
Folksam 11,400,000 11,400,000 3.9 1.9<br />
Anita Paulsson with family and companies 4,261,431 6,013,905 10,275,336 3.5 8.0<br />
Fredrik Paulsson with family and companies 4,261,430 6,002,154 10,263,584 3.5 8.0<br />
Svante Paulsson with family and companies 7,824,715 1,350,705 9,175,420 3.1 13.2<br />
Sara Karlsson with family and companies 7,881,948 863,299 8,745,247 3.0 13.2<br />
Kamprad family foundation 8,581,236 8,581,236 2.9 1.4<br />
<strong>Peab</strong>’s profit-share foundation 7,803,432 7,803,432 2.6 1.3<br />
Länsförsäkringar Funds 5,514,810 5,514,810 1.8 0.9<br />
Lannebo Fonder 5,512,029 5,512,029 1.8 0.9<br />
Handelsbanken Funds 4,891,231 4,891,231 1.6 0.8<br />
Danica Pension 4,276,300 4,276,300 1.4 0.7<br />
Swedbank Robur Funds 3,533,099 3,533,099 1.2 0.6<br />
SEB Investment Management 3,417,095 3,417,095 1.2 0.6<br />
Foreign shareholders 29,905,229 29,905,229 10.1 4.9<br />
Others 335,523 105,920,515 106,256,038 35.9 18.1<br />
Number of outstanding shares 34,319,957 260,642,789 294,962,746<br />
<strong>Peab</strong> AB 1,086,984 1,086,984 0.4 0.2<br />
Number of registered shares 34,319,957 261,729,773 296,049,730 100.0 100.0<br />
Data per share<br />
<strong>2012</strong> 2011<br />
Earnings, SEK 2.47 3.26<br />
– after dilution 2.47 3.26<br />
Equity, SEK 27.07 26.94<br />
– after dilution 27.07 28.10<br />
Cash flow before financing, SEK 0.34 –3.71<br />
– after dilution 0.33 –3.60<br />
Share price at year-end, SEK 31.04 34.30<br />
Share price/equity, % 114.7 127.3<br />
Dividend, SEK 1) 1.60 2.10<br />
Direct return, % 2) 5.2 6.1<br />
P/E-ratio 2) 1) For <strong>2012</strong>, Board of Directors’ proposal to the AGM<br />
2) Based on closing price at year-end<br />
13 11<br />
Earnings and dividend per share<br />
SEK SEK<br />
8<br />
4<br />
1)<br />
6<br />
4<br />
2<br />
0<br />
2008<br />
2009<br />
2010<br />
2011<br />
<strong>2012</strong><br />
Equity per share Dividend per share<br />
Equity per share<br />
SEK<br />
30<br />
25<br />
20<br />
15<br />
10<br />
5<br />
0<br />
2008<br />
2009<br />
2010<br />
2011<br />
<strong>2012</strong><br />
Shares and votes per share class 3)<br />
Share class Number<br />
Shareholder categories, proportion<br />
of capital 3)<br />
31%<br />
13%<br />
1) For <strong>2012</strong>, Board of Directors’ proposal to the AGM 3) Per 2013-02-28<br />
3<br />
2<br />
1<br />
0<br />
4%<br />
17%<br />
35%<br />
Number<br />
of votes<br />
Shareholder categories, proportion<br />
of votes 3)<br />
6%<br />
28%<br />
2%<br />
Proportion of<br />
capital, %<br />
8%<br />
Proportion of<br />
votes, %<br />
A 34,319,957 10 11.6 56.7<br />
B 261,729,773 1 88.4 43.3<br />
Total 296,049,730 100.0 100.0<br />
Financial companies and trust funds<br />
Other Swedish legal entities<br />
Allocation of shareholdings3) Number<br />
Number of Proportion<br />
of shares<br />
shareholders of capital, %<br />
Interest organizations<br />
Foregin shareholders<br />
Proportion<br />
of votes, %<br />
1– 500 14,440 1.0 0.5<br />
501– 1 000 5,495 1.6 0.8<br />
1 001– 5 000 8,101 6.8 3.3<br />
5 001– 10 000 1,598 3.9 1.9<br />
10 001– 15 000 718 2.9 1.4<br />
15 001– 20 000 269 1.6 0.8<br />
20 001– 745 82.2 91.3<br />
31,366 100.0 100.0<br />
3) Per 2013-02-28<br />
56%<br />
Swedish private persons<br />
PEAB ANNUAL REPORT <strong>2012</strong><br />
93