


Create successful ePaper yourself
Turn your PDF publications into a flip-book with our unique Google optimized e-Paper software.
NOTES<br />
1<br />
2<br />
3<br />
4<br />
5<br />
6<br />
7<br />
8<br />
9<br />
10<br />
11<br />
12<br />
13<br />
14<br />
15<br />
16<br />
17<br />
18<br />
19<br />
20<br />
21<br />
22<br />
23<br />
24<br />
25<br />
26<br />
27<br />
28<br />
29<br />
30<br />
31<br />
32<br />
33<br />
34<br />
35<br />
36<br />
37<br />
38<br />
39<br />
40<br />
41<br />
42<br />
43<br />
44<br />
45<br />
46<br />
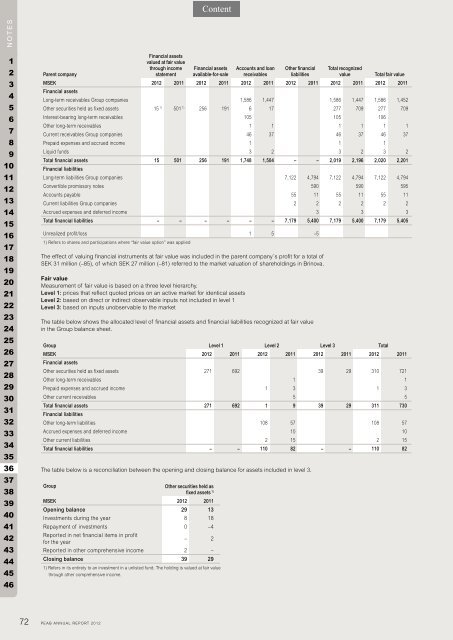
Parent company<br />
Financial assets<br />
valued at fair value<br />
through income<br />
statement<br />
Financial assets<br />
available-for-sale<br />
Accounts and loan<br />
receivables<br />
Other financial<br />
liabilities<br />
Total recognized<br />
value Total fair value<br />
MSEK <strong>2012</strong> 2011 <strong>2012</strong> 2011 <strong>2012</strong> 2011 <strong>2012</strong> 2011 <strong>2012</strong> 2011 <strong>2012</strong> 2011<br />
Financial assets<br />
Long-term receivables Group companies 1,586 1,447 1,586 1,447 1,586 1,452<br />
Other securities held as fixed assets 15 1) 501 1) 256 191 6 17 277 709 277 709<br />
Interest-bearing long-term receivables 105 105 106<br />
Other long-term receivables 1 1 1 1 1 1<br />
Current receivables Group companies 46 37 46 37 46 37<br />
Prepaid expenses and accrued income 1 1 1<br />
Liquid funds 3 2 3 2 3 2<br />
Total financial assets<br />
Financial liabilities<br />
15 501 256 191 1,748 1,504 – – 2,019 2,196 2,020 2,201<br />
Long-term liabilities Group companies 7,122 4,794 7,122 4,794 7,122 4,794<br />
Convertible promissory notes 590 590 595<br />
Accounts payable 55 11 55 11 55 11<br />
Current liabilities Group companies 2 2 2 2 2 2<br />
Accrued expenses and deferred income 3 3 3<br />
Total financial liabilities – – – – – – 7,179 5,400 7,179 5,400 7,179 5,405<br />
Unrealized profit/loss<br />
1) Refers to shares and participations where “fair value option” was applied<br />
1 5 –5<br />
The effect of valuing financial instruments at fair value was included in the parent company´s profit for a total of<br />
SEK 31 million (–85), of which SEK 27 million (–81) referred to the market valuation of shareholdings in Brinova.<br />
Fair value<br />
Measurement of fair value is based on a three level hierarchy.<br />
Level 1: prices that reflect quoted prices on an active market for identical assets<br />
Level 2: based on direct or indirect observable inputs not included in level 1<br />
Level 3: based on inputs unobservable to the market<br />
The table below shows the allocated level of financial assets and financial liabilities recognized at fair value<br />
in the Group balance sheet.<br />
Group Level 1 Level 2 Level 3 Total<br />
MSEK<br />
Financial assets<br />
<strong>2012</strong> 2011 <strong>2012</strong> 2011 <strong>2012</strong> 2011 <strong>2012</strong> 2011<br />
Other securities held as fixed assets 271 692 39 29 310 721<br />
Other long-term receivables 1 1<br />
Prepaid expenses and accrued income 1 3 1 3<br />
Other current receivables 5 5<br />
Total financial assets<br />
Financial liabilities<br />
271 692 1 9 39 29 311 730<br />
Other long-term liabilities 108 57 108 57<br />
Accrued expenses and deferred income 10 10<br />
Other current liabilities 2 15 2 15<br />
Total financial liabilities – – 110 82 – – 110 82<br />
The table below is a reconciliation between the opening and closing balance for assets included in level 3.<br />
Group Other securities held as<br />
fixed assets 1)<br />
MSEK <strong>2012</strong> 2011<br />
Opening balance 29 13<br />
Investments during the year 8 18<br />
Repayment of investments 0 –4<br />
Reported in net financial items in profit<br />
for the year<br />
– 2<br />
Reported in other comprehensive income 2 –<br />
Closing balance 39 29<br />
1) Refers in its entirety to an investment in a unlisted fund. The holding is valued at fair value<br />
through other comprehensive income.<br />
72 PEAB ANNUAL REPORT <strong>2012</strong>