TNPFA 4.1.1 Installation and User Guide - e IBM Tivoli Composite ...
TNPFA 4.1.1 Installation and User Guide - e IBM Tivoli Composite ...
TNPFA 4.1.1 Installation and User Guide - e IBM Tivoli Composite ...

You also want an ePaper? Increase the reach of your titles
YUMPU automatically turns print PDFs into web optimized ePapers that Google loves.
Chapter 5. Traffic analyzer<br />
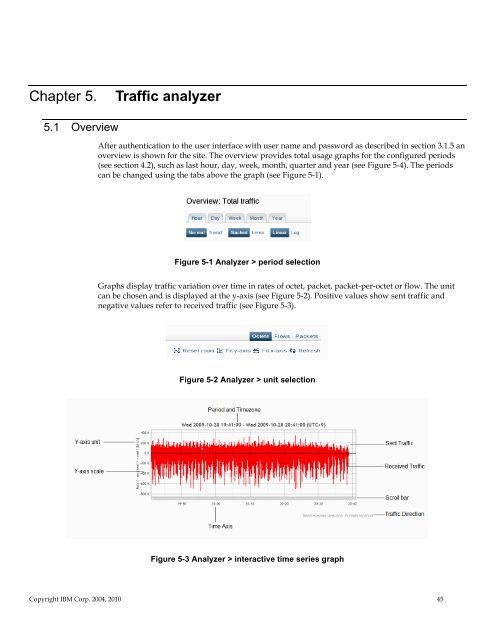
5.1 Overview<br />
After authentication to the user interface with user name <strong>and</strong> password as described in section 3.1.5 an<br />
overview is shown for the site. The overview provides total usage graphs for the configured periods<br />
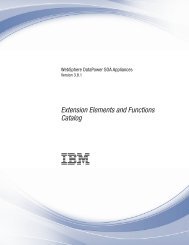
(see section 4.2), such as last hour, day, week, month, quarter <strong>and</strong> year (see Figure 5-4). The periods<br />
can be changed using the tabs above the graph (see Figure 5-1).<br />
Figure 5-1 Analyzer > period selection<br />
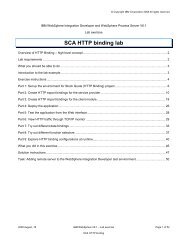
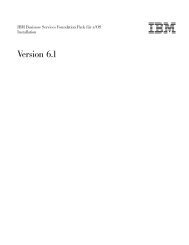
Graphs display traffic variation over time in rates of octet, packet, packet-per-octet or flow. The unit<br />
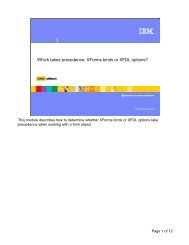
can be chosen <strong>and</strong> is displayed at the y-axis (see Figure 5-2). Positive values show sent traffic <strong>and</strong><br />
negative values refer to received traffic (see Figure 5-3).<br />
Figure 5-2 Analyzer > unit selection<br />
Figure 5-3 Analyzer > interactive time series graph<br />
Copyright <strong>IBM</strong> Corp. 2004, 2010 45