TNPFA 4.1.1 Installation and User Guide - e IBM Tivoli Composite ...
TNPFA 4.1.1 Installation and User Guide - e IBM Tivoli Composite ...
TNPFA 4.1.1 Installation and User Guide - e IBM Tivoli Composite ...

Create successful ePaper yourself
Turn your PDF publications into a flip-book with our unique Google optimized e-Paper software.
5.2 Aspect views<br />
Traffic views are snapshots of the currently occurring traffic situation. The current traffic situation can<br />
be viewed for configured traffic aspects, periods <strong>and</strong> various display options (for example, normal <strong>and</strong><br />
trend graph, pie chart, stacked or lines as well as linear or logarithmic, or Log format). The periods are<br />
the last hour (that is, last 60 minutes), last day (that is, last 24 hours), last month (last 31 days) <strong>and</strong> so<br />
on 1<br />
.<br />
Traffic volumes are given with most display options. According to IEC St<strong>and</strong>ard, volumes are<br />
provided in B (bytes), KiB (kilo binary bytes), MiB (mega binary bytes), GiB (giga binary bytes), <strong>and</strong><br />
TiB (tera binary bytes):<br />
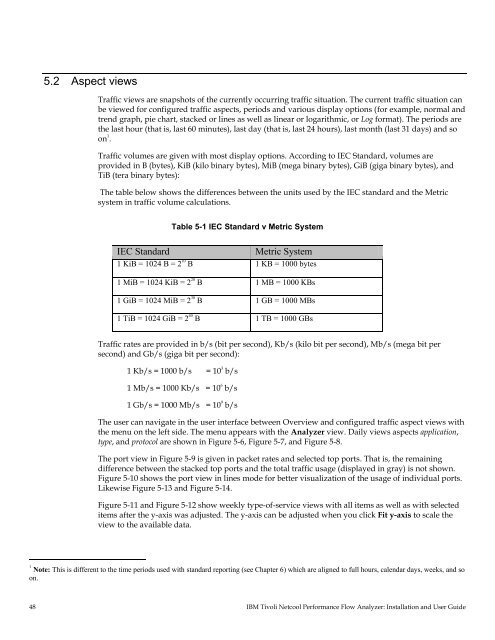
The table below shows the differences between the units used by the IEC st<strong>and</strong>ard <strong>and</strong> the Metric<br />
system in traffic volume calculations.<br />
Table 5-1 IEC St<strong>and</strong>ard v Metric System<br />
IEC St<strong>and</strong>ard Metric System<br />
1 KiB = 1024 B = 2 10<br />
B 1 KB = 1000 bytes<br />
1 MiB = 1024 KiB = 2 20 B<br />
1 MB = 1000 KBs<br />
1 GiB = 1024 MiB = 2 30 B 1 GB = 1000 MBs<br />
1 TiB = 1024 GiB = 2 40 B<br />
1 TB = 1000 GBs<br />
Traffic rates are provided in b/s (bit per second), Kb/s (kilo bit per second), Mb/s (mega bit per<br />
second) <strong>and</strong> Gb/s (giga bit per second):<br />
1 Kb/s = 1000 b/s = 10 3 b/s<br />
1 Mb/s = 1000 Kb/s = 10 6<br />
b/s<br />
1 Gb/s = 1000 Mb/s = 10 9<br />
b/s<br />
The user can navigate in the user interface between Overview <strong>and</strong> configured traffic aspect views with<br />
the menu on the left side. The menu appears with the Analyzer view. Daily views aspects application,<br />
type, <strong>and</strong> protocol are shown in Figure 5-6, Figure 5-7, <strong>and</strong> Figure 5-8.<br />
The port view in Figure 5-9 is given in packet rates <strong>and</strong> selected top ports. That is, the remaining<br />
difference between the stacked top ports <strong>and</strong> the total traffic usage (displayed in gray) is not shown.<br />
Figure 5-10 shows the port view in lines mode for better visualization of the usage of individual ports.<br />
Likewise Figure 5-13 <strong>and</strong> Figure 5-14.<br />
Figure 5-11 <strong>and</strong> Figure 5-12 show weekly type-of-service views with all items as well as with selected<br />
items after the y-axis was adjusted. The y-axis can be adjusted when you click Fit y-axis to scale the<br />
view to the available data.<br />
1 Note: This is different to the time periods used with st<strong>and</strong>ard reporting (see Chapter 6) which are aligned to full hours, calendar days, weeks, <strong>and</strong> so<br />
on.<br />
48 <strong>IBM</strong> <strong>Tivoli</strong> Netcool Performance Flow Analyzer: <strong>Installation</strong> <strong>and</strong> <strong>User</strong> <strong>Guide</strong>