TNPFA 4.1.1 Installation and User Guide - e IBM Tivoli Composite ...
TNPFA 4.1.1 Installation and User Guide - e IBM Tivoli Composite ...
TNPFA 4.1.1 Installation and User Guide - e IBM Tivoli Composite ...
You also want an ePaper? Increase the reach of your titles
YUMPU automatically turns print PDFs into web optimized ePapers that Google loves.
Site<br />
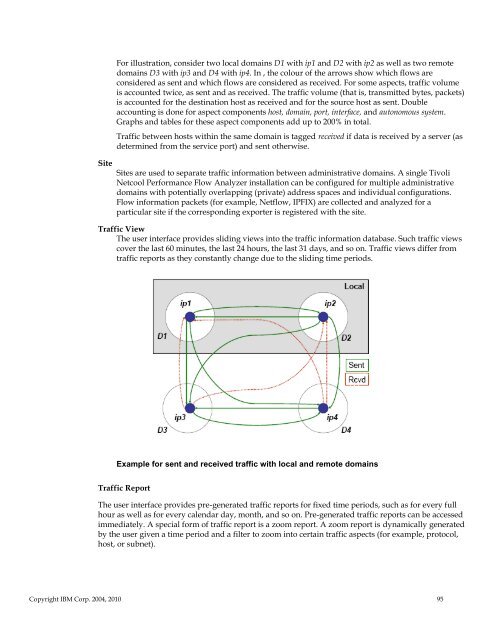
For illustration, consider two local domains D1 with ip1 <strong>and</strong> D2 with ip2 as well as two remote<br />
domains D3 with ip3 <strong>and</strong> D4 with ip4. In , the colour of the arrows show which flows are<br />
considered as sent <strong>and</strong> which flows are considered as received. For some aspects, traffic volume<br />
is accounted twice, as sent <strong>and</strong> as received. The traffic volume (that is, transmitted bytes, packets)<br />
is accounted for the destination host as received <strong>and</strong> for the source host as sent. Double<br />
accounting is done for aspect components host, domain, port, interface, <strong>and</strong> autonomous system.<br />
Graphs <strong>and</strong> tables for these aspect components add up to 200% in total.<br />
Traffic between hosts within the same domain is tagged received if data is received by a server (as<br />
determined from the service port) <strong>and</strong> sent otherwise.<br />
Sites are used to separate traffic information between administrative domains. A single <strong>Tivoli</strong><br />
Netcool Performance Flow Analyzer installation can be configured for multiple administrative<br />
domains with potentially overlapping (private) address spaces <strong>and</strong> individual configurations.<br />
Flow information packets (for example, Netflow, IPFIX) are collected <strong>and</strong> analyzed for a<br />
particular site if the corresponding exporter is registered with the site.<br />
Traffic View<br />
The user interface provides sliding views into the traffic information database. Such traffic views<br />
cover the last 60 minutes, the last 24 hours, the last 31 days, <strong>and</strong> so on. Traffic views differ from<br />
traffic reports as they constantly change due to the sliding time periods.<br />
Example for sent <strong>and</strong> received traffic with local <strong>and</strong> remote domains<br />
Traffic Report<br />
The user interface provides pre-generated traffic reports for fixed time periods, such as for every full<br />
hour as well as for every calendar day, month, <strong>and</strong> so on. Pre-generated traffic reports can be accessed<br />
immediately. A special form of traffic report is a zoom report. A zoom report is dynamically generated<br />
by the user given a time period <strong>and</strong> a filter to zoom into certain traffic aspects (for example, protocol,<br />
host, or subnet).<br />
Copyright <strong>IBM</strong> Corp. 2004, 2010 95


