View/Open - Scholarly Commons Home
View/Open - Scholarly Commons Home
View/Open - Scholarly Commons Home
You also want an ePaper? Increase the reach of your titles
YUMPU automatically turns print PDFs into web optimized ePapers that Google loves.
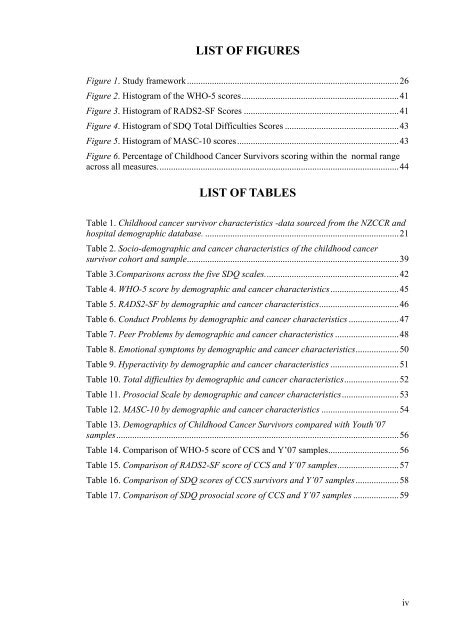
LIST OF FIGURES<br />
Figure 1. Study framework.............................................................................................26<br />
Figure 2. Histogram of the WHO-5 scores.....................................................................41<br />
Figure 3. Histogram of RADS2-SF Scores ....................................................................41<br />
Figure 4. Histogram of SDQ Total Difficulties Scores ..................................................43<br />
Figure 5. Histogram of MASC-10 scores.......................................................................43<br />
Figure 6. Percentage of Childhood Cancer Survivors scoring within the normal range<br />
across all measures..........................................................................................................44<br />
LIST OF TABLES<br />
Table 1. Childhood cancer survivor characteristics -data sourced from the NZCCR and<br />
hospital demographic database. .....................................................................................21<br />
Table 2. Socio-demographic and cancer characteristics of the childhood cancer<br />
survivor cohort and sample.............................................................................................39<br />
Table 3.Comparisons across the five SDQ scales...........................................................42<br />
Table 4. WHO-5 score by demographic and cancer characteristics..............................45<br />
Table 5. RADS2-SF by demographic and cancer characteristics...................................46<br />
Table 6. Conduct Problems by demographic and cancer characteristics ......................47<br />
Table 7. Peer Problems by demographic and cancer characteristics ............................48<br />
Table 8. Emotional symptoms by demographic and cancer characteristics...................50<br />
Table 9. Hyperactivity by demographic and cancer characteristics ..............................51<br />
Table 10. Total difficulties by demographic and cancer characteristics........................52<br />
Table 11. Prosocial Scale by demographic and cancer characteristics.........................53<br />
Table 12. MASC-10 by demographic and cancer characteristics ..................................54<br />
Table 13. Demographics of Childhood Cancer Survivors compared with Youth’07<br />
samples............................................................................................................................56<br />
Table 14. Comparison of WHO-5 score of CCS and Y’07 samples...............................56<br />
Table 15. Comparison of RADS2-SF score of CCS and Y’07 samples...........................57<br />
Table 16. Comparison of SDQ scores of CCS survivors and Y’07 samples...................58<br />
Table 17. Comparison of SDQ prosocial score of CCS and Y’07 samples ....................59<br />
iv


