

View/Open - Scholarly Commons Home
View/Open - Scholarly Commons Home
View/Open - Scholarly Commons Home

You also want an ePaper? Increase the reach of your titles
YUMPU automatically turns print PDFs into web optimized ePapers that Google loves.
Time since<br />
diagnosis<br />
Abnormal/<br />
Borderline<br />
Normal<br />
Mean 9.6 9.9 0.71<br />
Median 10.1 10.3<br />
Range 3.8 to 14.7 2.5 to 17.3<br />
Surgery N 12 15.0 68 85.0 0.84<br />
Y 12 14.5 71 85.5<br />
Chemotherapy N 3 15.0 17 85.0 0.98<br />
Y 21 14.7 122 85.3<br />
RT N 18 14.6 105 85.4 0.91<br />
Y 6 15.0 34 85.0<br />
HSCT N 20 14.0 123 86.0 0.53<br />
Y 4 20.0 16 80.0<br />
*Pearson’s Chi-Square used for categorical variables and t-tests for continuous variables<br />
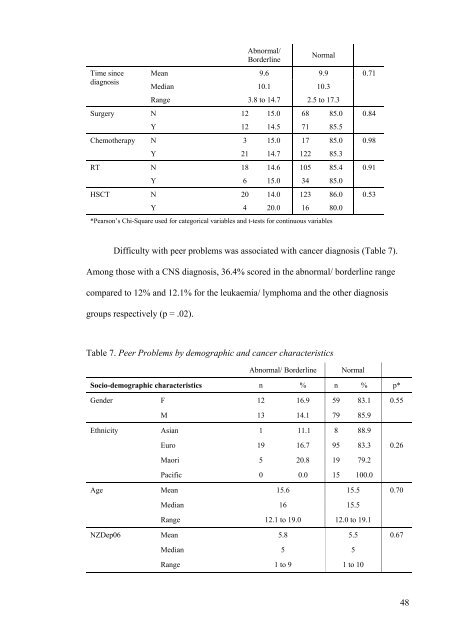
Difficulty with peer problems was associated with cancer diagnosis (Table 7).<br />
Among those with a CNS diagnosis, 36.4% scored in the abnormal/ borderline range<br />
compared to 12% and 12.1% for the leukaemia/ lymphoma and the other diagnosis<br />
groups respectively (p = .02).<br />
Table 7. Peer Problems by demographic and cancer characteristics<br />
Abnormal/ Borderline Normal<br />
Socio-demographic characteristics n % n % p*<br />
Gender F 12 16.9 59 83.1 0.55<br />
M 13 14.1 79 85.9<br />
Ethnicity Asian 1 11.1 8 88.9<br />
Euro 19 16.7 95 83.3 0.26<br />
Maori 5 20.8 19 79.2<br />
Pacific 0 0.0 15 100.0<br />
Age Mean 15.6 15.5 0.70<br />
Median 16 15.5<br />
Range 12.1 to 19.0 12.0 to 19.1<br />
NZDep06 Mean 5.8 5.5 0.67<br />
Median 5 5<br />
Range 1 to 9 1 to 10<br />
48


