

View/Open - Scholarly Commons Home
View/Open - Scholarly Commons Home
View/Open - Scholarly Commons Home

You also want an ePaper? Increase the reach of your titles
YUMPU automatically turns print PDFs into web optimized ePapers that Google loves.
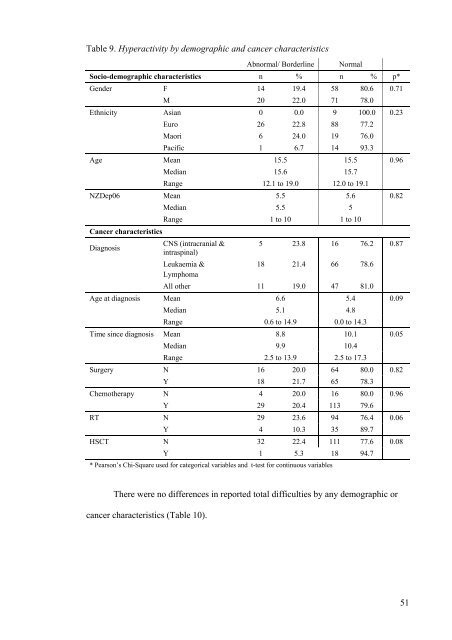
Table 9. Hyperactivity by demographic and cancer characteristics<br />
Abnormal/ Borderline Normal<br />
Socio-demographic characteristics n % n % p*<br />
Gender F 14 19.4 58 80.6 0.71<br />
M 20 22.0 71 78.0<br />
Ethnicity Asian 0 0.0 9 100.0 0.23<br />
Euro 26 22.8 88 77.2<br />
Maori 6 24.0 19 76.0<br />
Pacific 1 6.7 14 93.3<br />
Age Mean 15.5 15.5 0.96<br />
Median 15.6 15.7<br />
Range 12.1 to 19.0 12.0 to 19.1<br />
NZDep06 Mean 5.5 5.6 0.82<br />
Cancer characteristics<br />
Median 5.5 5<br />
Range 1 to 10 1 to 10<br />
Diagnosis<br />
CNS (intracranial &<br />
intraspinal)<br />
5 23.8 16 76.2 0.87<br />
Leukaemia &<br />
Lymphoma<br />
18 21.4 66 78.6<br />
All other 11 19.0 47 81.0<br />
Age at diagnosis Mean 6.6 5.4 0.09<br />
Median 5.1 4.8<br />
Range 0.6 to 14.9 0.0 to 14.3<br />
Time since diagnosis Mean 8.8 10.1 0.05<br />
Median 9.9 10.4<br />
Range 2.5 to 13.9 2.5 to 17.3<br />
Surgery N 16 20.0 64 80.0 0.82<br />
Y 18 21.7 65 78.3<br />
Chemotherapy N 4 20.0 16 80.0 0.96<br />
Y 29 20.4 113 79.6<br />
RT N 29 23.6 94 76.4 0.06<br />
Y 4 10.3 35 89.7<br />
HSCT N 32 22.4 111 77.6 0.08<br />
Y 1 5.3 18 94.7<br />
* Pearson’s Chi-Square used for categorical variables and t-test for continuous variables<br />
There were no differences in reported total difficulties by any demographic or<br />
cancer characteristics (Table 10).<br />
51


