Scientific Theme: Advanced Modeling and Observing Systems
Scientific Theme: Advanced Modeling and Observing Systems
Scientific Theme: Advanced Modeling and Observing Systems

You also want an ePaper? Increase the reach of your titles
YUMPU automatically turns print PDFs into web optimized ePapers that Google loves.
k 1(T) (10 -11 cm 3 molecule -1 s -1 )<br />
400 333 286 250 222 200 K<br />
10<br />
7<br />
9<br />
8<br />
7<br />
6<br />
5<br />
4<br />
3<br />
2<br />
1<br />
2.5<br />
3.0<br />
3.5 4.0<br />
1000/T (K -1 )<br />
<strong>Scientific</strong> <strong>Theme</strong>: Regional Processes<br />
4.5<br />
6<br />
5<br />
4<br />
3<br />
2<br />
5.0<br />
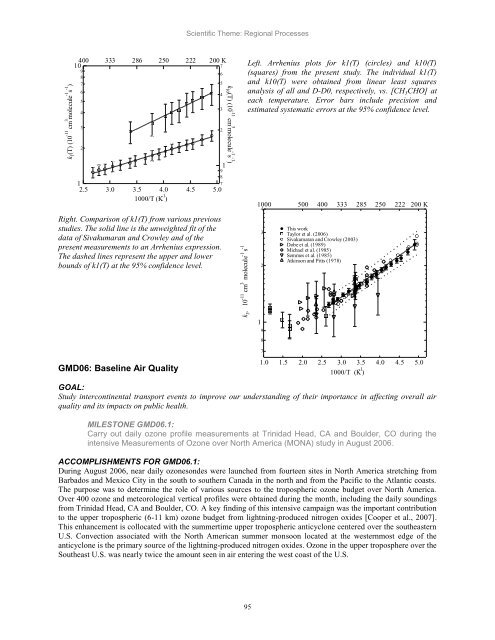
Right. Comparison of k1(T) from various previous<br />
studies. The solid line is the unweighted fit of the<br />
data of Sivakumaran <strong>and</strong> Crowley <strong>and</strong> of the<br />
present measurements to an Arrhenius expression.<br />
The dashed lines represent the upper <strong>and</strong> lower<br />
bounds of k1(T) at the 95% confidence level.<br />
GMD06: Baseline Air Quality<br />
1<br />
9<br />
8<br />
7<br />
k 10(T) (10 -11 cm 3 molecule -1 s -1 )<br />
k 1 , 10 -11 cm 3 molecule -1 s -1<br />
Left. Arrhenius plots for k1(T) (circles) <strong>and</strong> k10(T)<br />
(squares) from the present study. The individual k1(T)<br />
<strong>and</strong> k10(T) were obtained from linear least squares<br />
analysis of all <strong>and</strong> D-D0, respectively, vs. [CH3CHO] at<br />
each temperature. Error bars include precision <strong>and</strong><br />
estimated systematic errors at the 95% confidence level.<br />
95<br />
1000 500 400 333 285 250 222 200 K<br />
1<br />
4<br />
3<br />
2<br />
9<br />
8<br />
7<br />
1.0<br />
1.5<br />
This work<br />
Taylor et al. (2006)<br />
Sivakumaran <strong>and</strong> Crowley (2003)<br />
Dobe et al. (1989)<br />
Michael et al. (1985)<br />
Semmes et al. (1985)<br />
Atkinson <strong>and</strong> Pitts (1978)<br />
2.0<br />
2.5 3.0 3.5<br />
1000/T (K -1 )<br />
GOAL:<br />
Study intercontinental transport events to improve our underst<strong>and</strong>ing of their importance in affecting overall air<br />
quality <strong>and</strong> its impacts on public health.<br />
MILESTONE GMD06.1:<br />
Carry out daily ozone profile measurements at Trinidad Head, CA <strong>and</strong> Boulder, CO during the<br />
intensive Measurements of Ozone over North America (MONA) study in August 2006.<br />
ACCOMPLISHMENTS FOR GMD06.1:<br />
During August 2006, near daily ozonesondes were launched from fourteen sites in North America stretching from<br />
Barbados <strong>and</strong> Mexico City in the south to southern Canada in the north <strong>and</strong> from the Pacific to the Atlantic coasts.<br />
The purpose was to determine the role of various sources to the tropospheric ozone budget over North America.<br />
Over 400 ozone <strong>and</strong> meteorological vertical profiles were obtained during the month, including the daily soundings<br />
from Trinidad Head, CA <strong>and</strong> Boulder, CO. A key finding of this intensive campaign was the important contribution<br />
to the upper tropospheric (6-11 km) ozone budget from lightning-produced nitrogen oxides [Cooper et al., 2007].<br />
This enhancement is collocated with the summertime upper tropospheric anticyclone centered over the southeastern<br />
U.S. Convection associated with the North American summer monsoon located at the westernmost edge of the<br />
anticyclone is the primary source of the lightning-produced nitrogen oxides. Ozone in the upper troposphere over the<br />
Southeast U.S. was nearly twice the amount seen in air entering the west coast of the U.S.<br />
4.0<br />
4.5<br />
5.0