2020 Vision for Athy - Entire Document - Kildare.ie
2020 Vision for Athy - Entire Document - Kildare.ie
2020 Vision for Athy - Entire Document - Kildare.ie

Create successful ePaper yourself
Turn your PDF publications into a flip-book with our unique Google optimized e-Paper software.
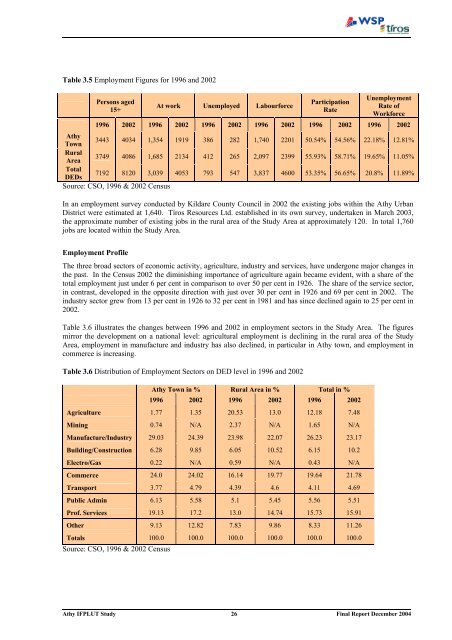
Table 3.5 Employment Figures <strong>for</strong> 1996 and 2002<br />
Persons aged<br />
15+<br />
At work Unemployed Labour<strong>for</strong>ce<br />
Participation<br />
Rate<br />
Unemployment<br />
Rate of<br />
Work<strong>for</strong>ce<br />
1996 2002 1996 2002 1996 2002 1996 2002 1996 2002 1996 2002<br />
<strong>Athy</strong><br />
Town<br />
3443 4034 1,354 1919 386 282 1,740 2201 50.54% 54.56% 22.18% 12.81%<br />
Rural<br />
Area<br />
3749 4086 1,685 2134 412 265 2,097 2399 55.93% 58.71% 19.65% 11.05%<br />
Total<br />
DEDs<br />
7192 8120 3,039 4053 793 547 3,837 4600 53.35% 56.65% 20.8% 11.89%<br />
Source: CSO, 1996 & 2002 Census<br />
In an employment survey conducted by <strong>Kildare</strong> County Council in 2002 the existing jobs within the <strong>Athy</strong> Urban<br />
District were estimated at 1,640. Tíros Resources Ltd. established in its own survey, undertaken in March 2003,<br />
the approximate number of existing jobs in the rural area of the Study Area at approximately 120. In total 1,760<br />
jobs are located within the Study Area.<br />
Employment Profile<br />
The three broad sectors of economic activity, agriculture, industry and services, have undergone major changes in<br />
the past. In the Census 2002 the diminishing importance of agriculture again became evident, with a share of the<br />
total employment just under 6 per cent in comparison to over 50 per cent in 1926. The share of the service sector,<br />
in contrast, developed in the opposite direction with just over 30 per cent in 1926 and 69 per cent in 2002. The<br />
industry sector grew from 13 per cent in 1926 to 32 per cent in 1981 and has since declined again to 25 per cent in<br />
2002.<br />
Table 3.6 illustrates the changes between 1996 and 2002 in employment sectors in the Study Area. The figures<br />
mirror the development on a national level: agricultural employment is declining in the rural area of the Study<br />
Area, employment in manufacture and industry has also declined, in particular in <strong>Athy</strong> town, and employment in<br />
commerce is increasing.<br />
Table 3.6 Distribution of Employment Sectors on DED level in 1996 and 2002<br />
<strong>Athy</strong> Town in % Rural Area in % Total in %<br />
1996 2002 1996 2002 1996 2002<br />
Agriculture 1.77 1.35 20.53 13.0 12.18 7.48<br />
Mining 0.74 N/A 2.37 N/A 1.65 N/A<br />
Manufacture/Industry 29.03 24.39 23.98 22.07 26.23 23.17<br />
Building/Construction 6.28 9.85 6.05 10.52 6.15 10.2<br />
Electro/Gas 0.22 N/A 0.59 N/A 0.43 N/A<br />
Commerce 24.0 24.02 16.14 19.77 19.64 21.78<br />
Transport 3.77 4.79 4.39 4.6 4.11 4.69<br />
Public Admin 6.13 5.58 5.1 5.45 5.56 5.51<br />
Prof. Services 19.13 17.2 13.0 14.74 15.73 15.91<br />
Other 9.13 12.82 7.83 9.86 8.33 11.26<br />
Totals 100.0 100.0 100.0 100.0 100.0 100.0<br />
Source: CSO, 1996 & 2002 Census<br />
<strong>Athy</strong> IFPLUT Study 26 Final Report December 2004