2020 Vision for Athy - Entire Document - Kildare.ie
2020 Vision for Athy - Entire Document - Kildare.ie
2020 Vision for Athy - Entire Document - Kildare.ie

You also want an ePaper? Increase the reach of your titles
YUMPU automatically turns print PDFs into web optimized ePapers that Google loves.
8 ASSESSMENT OF VIABLE SCENARIOS<br />
In Section 7 two out of six scenarios have been ruled out by way of assessing them in terms of their compliance<br />
with the guiding principles. Scenario A, B, C and D are now further assessed against objectives 1-9 and 11.<br />
Objectives 10 and 12 are assessed in Section 9 using the MEPLAN and SATURN modelling suites.<br />
Each of the scenarios accommodates the following, as outlined in section 7.1:<br />
• An urban population increase of 6,800<br />
• 2,500 new households<br />
• 6,700 new jobs<br />
Each of the scenarios are based on the following land use assumptions:<br />
Future Residential in Scenario A: Residential density of 30 units /ha as per the Town Development Plan<br />
standards<br />
Future Residential in Scenarios B, C and D: Residential density of 50 units/ha within 600m from town<br />
centre and train station, residential density of 35units/ha outside these catchments<br />
Future Commercial: Generally 50% retailing, 25% offices and 25% apartments<br />
Future Low Density Employment: 60% industry and 40% warehousing<br />
Future High Density Employment: Generally 50% offices, 25% industry and 35% warehousing<br />
In addition each scenario was assessed by modelling the walking distances from the residential areas to the key trip<br />
attractions. This assessment tool contributes in the selection of the preferred scenario or highlights elements of<br />
particular scenarios based on penetration of the town and its facilit<strong>ie</strong>s by sustainable modes of transport.<br />
The modelling process works by calculating the distance from various residential areas to the town’s major trip<br />
attractions. The major trip attractions include the commercial town centre, rail station, primary and secondary<br />
schools and employment centres. These walking distances are then evaluated against the acceptable walking<br />
distances to the various land uses. From this analysis the population living within acceptable walking distances of<br />
the major trip attractions can be calculated and a comparison made as to the level of sustainability of each land use<br />
scenario.<br />
Table 8.1 below details the various walking distance thresholds <strong>for</strong> each of the land uses. These distances are based<br />
in particular on guidance set out in ‘Guidelines <strong>for</strong> Providing <strong>for</strong> Journeys by Foot (2000)’ published by the<br />
Institution of Highways and Transportation and also on the appreciation of the scale and layout of the Study Area.<br />
It should be noted that the distances to the various trip attractions was measured from the centroid of the residential<br />
land mass. There<strong>for</strong>e, although on average the land mass may l<strong>ie</strong> outside of the walking threshold, a significant<br />
proportion may still l<strong>ie</strong> within the acceptable or desirable distance to the trip attraction.<br />
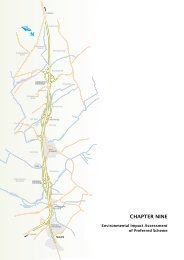
The descriptions of the viable scenarios are accompan<strong>ie</strong>d by maps illustrating the desirable and acceptable walking<br />
distances from the town centre, schools and rail stations. On these maps the main residential areas are denoted as A<br />
to H.<br />
<strong>Athy</strong> IFPLUT Study 64 Final Report December 2004