THE ROLE OF THE
THE ROLE OF THE
THE ROLE OF THE

You also want an ePaper? Increase the reach of your titles
YUMPU automatically turns print PDFs into web optimized ePapers that Google loves.
4 The Role of the Chemist in Automotive Design<br />
Comfort Package<br />
Towing Capacity<br />
tire pressure monitoring systems, chrome wheels, or leather seating). Now, if we<br />
imagine these curves in a series, we will have what is known as an indifference map.<br />
According to Mansfield, “A consumer’s indifference map lies at the heart of the<br />
theory of consumer behavior, since such a map provides a representation of the consumer’s<br />
taste” [5]. The shape of these indifference maps gives the marketing group<br />
an indication of the options and desires of the customer.<br />
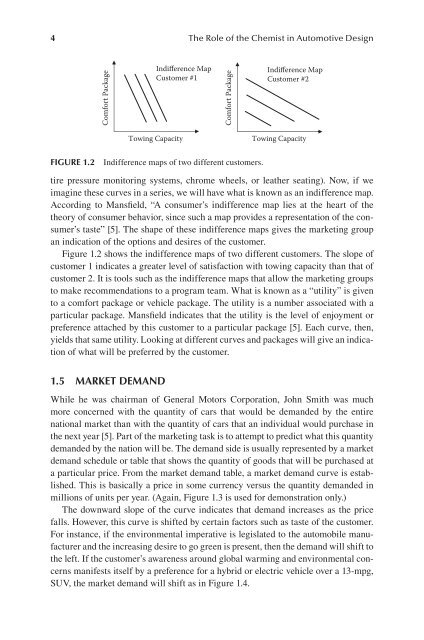
Figure 1.2 shows the indifference maps of two different customers. The slope of<br />
customer 1 indicates a greater level of satisfaction with towing capacity than that of<br />
customer 2. It is tools such as the indifference maps that allow the marketing groups<br />
to make recommendations to a program team. What is known as a “utility” is given<br />
to a comfort package or vehicle package. The utility is a number associated with a<br />
particular package. Mansfield indicates that the utility is the level of enjoyment or<br />
preference attached by this customer to a particular package [5]. Each curve, then,<br />
yields that same utility. Looking at different curves and packages will give an indication<br />
of what will be preferred by the customer.<br />
1.5 marKet demand<br />
Indifference Map<br />
Customer #1<br />
FIgure 1.2 Indifference maps of two different customers.<br />
Towing Capacity<br />
While he was chairman of General Motors Corporation, John Smith was much<br />
more concerned with the quantity of cars that would be demanded by the entire<br />
national market than with the quantity of cars that an individual would purchase in<br />
the next year [5]. Part of the marketing task is to attempt to predict what this quantity<br />
demanded by the nation will be. The demand side is usually represented by a market<br />
demand schedule or table that shows the quantity of goods that will be purchased at<br />
a particular price. From the market demand table, a market demand curve is established.<br />
This is basically a price in some currency versus the quantity demanded in<br />
millions of units per year. (Again, Figure 1.3 is used for demonstration only.)<br />
The downward slope of the curve indicates that demand increases as the price<br />
falls. However, this curve is shifted by certain factors such as taste of the customer.<br />
For instance, if the environmental imperative is legislated to the automobile manufacturer<br />
and the increasing desire to go green is present, then the demand will shift to<br />
the left. If the customer’s awareness around global warming and environmental concerns<br />
manifests itself by a preference for a hybrid or electric vehicle over a 13-mpg,<br />
SUV, the market demand will shift as in Figure 1.4.<br />
Comfort Package<br />
Indifference Map<br />
Customer #2