Download - heidenhain - DR. JOHANNES HEIDENHAIN GmbH
Download - heidenhain - DR. JOHANNES HEIDENHAIN GmbH
Download - heidenhain - DR. JOHANNES HEIDENHAIN GmbH

Create successful ePaper yourself
Turn your PDF publications into a flip-book with our unique Google optimized e-Paper software.
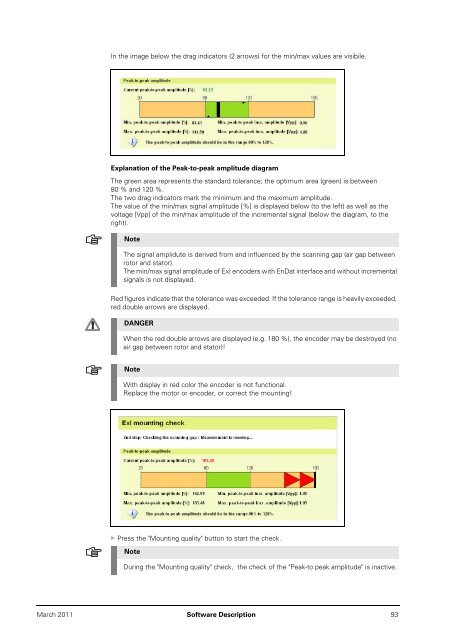
In the image below the drag indicators (2 arrows) for the min/max values are visibile.<br />
Explanation of the Peak-to-peak amplitude diagram<br />
The green area represents the standard tolerance; the optimum area (green) is between<br />
80 % and 120 %.<br />
The two drag indicators mark the minimum and the maximum amplitude.<br />
The value of the min/max signal amplitude [%] is displayed below (to the left) as well as the<br />
voltage [Vpp] of the min/max amplitude of the incremental signal (below the diagram, to the<br />
right).<br />
Note<br />
The signal amplidute is derived from and influenced by the scanning gap (air gap between<br />
rotor and stator).<br />
The min/max signal amplitude of ExI encoders with EnDat interface and without incremental<br />
signals is not displayed.<br />
Red figures indicate that the tolerance was exceeded. If the tolerance range is heavily exceeded,<br />
red double arrows are displayed.<br />
DANGER<br />
When the red double arrows are displayed (e.g. 180 %), the encoder may be destroyed (no<br />
air gap between rotor and stator)!<br />
Note<br />
With display in red color the encoder is not functional.<br />
Replace the motor or encoder, or correct the mounting!<br />
Press the "Mounting quality" button to start the check.<br />
Note<br />
During the "Mounting quality" check, the check of the "Peak-to peak amplitude" is inactive.<br />
March 2011 Software Description 93