Soner Bekleric Title of Thesis: Nonlinear Prediction via Volterra Ser
Soner Bekleric Title of Thesis: Nonlinear Prediction via Volterra Ser
Soner Bekleric Title of Thesis: Nonlinear Prediction via Volterra Ser

Create successful ePaper yourself
Turn your PDF publications into a flip-book with our unique Google optimized e-Paper software.
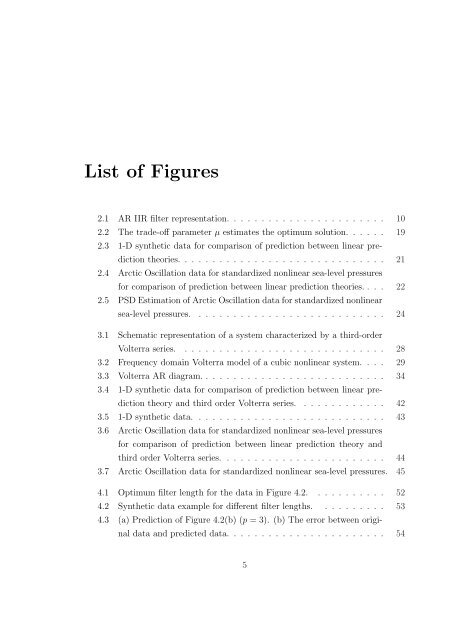
List <strong>of</strong> Figures<br />
2.1 AR IIR filter representation. . . . . . . . . . . . . . . . . . . . . . . 10<br />
2.2 The trade-<strong>of</strong>f parameter µ estimates the optimum solution. . . . . . 19<br />
2.3 1-D synthetic data for comparison <strong>of</strong> prediction between linear pre-<br />
diction theories. . . . . . . . . . . . . . . . . . . . . . . . . . . . . . 21<br />
2.4 Arctic Oscillation data for standardized nonlinear sea-level pressures<br />
for comparison <strong>of</strong> prediction between linear prediction theories. . . . 22<br />
2.5 PSD Estimation <strong>of</strong> Arctic Oscillation data for standardized nonlinear<br />
sea-level pressures. . . . . . . . . . . . . . . . . . . . . . . . . . . . 24<br />
3.1 Schematic representation <strong>of</strong> a system characterized by a third-order<br />
<strong>Volterra</strong> series. . . . . . . . . . . . . . . . . . . . . . . . . . . . . . 28<br />
3.2 Frequency domain <strong>Volterra</strong> model <strong>of</strong> a cubic nonlinear system. . . . 29<br />
3.3 <strong>Volterra</strong> AR diagram. . . . . . . . . . . . . . . . . . . . . . . . . . . 34<br />
3.4 1-D synthetic data for comparison <strong>of</strong> prediction between linear pre-<br />
diction theory and third order <strong>Volterra</strong> series. . . . . . . . . . . . . 42<br />
3.5 1-D synthetic data. . . . . . . . . . . . . . . . . . . . . . . . . . . . 43<br />
3.6 Arctic Oscillation data for standardized nonlinear sea-level pressures<br />
for comparison <strong>of</strong> prediction between linear prediction theory and<br />
third order <strong>Volterra</strong> series. . . . . . . . . . . . . . . . . . . . . . . . 44<br />
3.7 Arctic Oscillation data for standardized nonlinear sea-level pressures. 45<br />
4.1 Optimum filter length for the data in Figure 4.2. . . . . . . . . . . 52<br />
4.2 Synthetic data example for different filter lengths. . . . . . . . . . 53<br />
4.3 (a) <strong>Prediction</strong> <strong>of</strong> Figure 4.2(b) (p = 3). (b) The error between origi-<br />
nal data and predicted data. . . . . . . . . . . . . . . . . . . . . . . 54<br />
5