Soner Bekleric Title of Thesis: Nonlinear Prediction via Volterra Ser
Soner Bekleric Title of Thesis: Nonlinear Prediction via Volterra Ser
Soner Bekleric Title of Thesis: Nonlinear Prediction via Volterra Ser

Create successful ePaper yourself
Turn your PDF publications into a flip-book with our unique Google optimized e-Paper software.
5.4. REAL DATA EXAMPLES 83<br />
5.4 Real Data Examples<br />
In this section I will present a real data set from Gulf <strong>of</strong> Mexico subsalt data set.<br />
These data was made publically available to several research groups in order to test<br />
methods for multiple attenuation (Verschuur and Prein, 1999). The major problem<br />
in this data set is that the primaries are weaker than the multiples. The common<br />
<strong>of</strong>fset and shot gather data sets are recorded with 4 ms time sampling interval in 7<br />
seconds; the number <strong>of</strong> samples per traces are 1751 samples. I extracted 35 traces<br />
from a common <strong>of</strong>fset data set and 38 traces for shot gather data set to test our<br />
algorithm.<br />
In Figure 5.6(a) I portray a common <strong>of</strong>fset data set that contains multiples<br />
and primaries. Figure 5.6(b) shows the estimation <strong>of</strong> a multiple model <strong>via</strong> SRME<br />
method (Verschuur et al., 1992). Figure 5.6(c) is the solution obtained <strong>via</strong> classical<br />
linear prediction method. Linear prediction filter attenuates all multiples from<br />
the original data. Figure 5.6(d) is the solution with a third order <strong>Volterra</strong> series.<br />
<strong>Nonlinear</strong> prediction error filter provides a similar result to the linear one. Both<br />
methods were able to remove the multiples; particularly after 6 seconds in travel<br />
time, the primaries can be seen in Figures 5.6(c) and (d).<br />
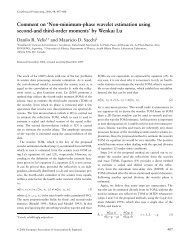
Figure 5.6(a) portrays the data. I can focus on an analysis interval between<br />
3.5 and 4.5 seconds for a better representation (in Figure 5.7(a)). Figure 5.7(c)<br />
shows that the linear prediction error filter works quite well, but it also distorts<br />
some events that are not present in the multiple model. Red solid arrow indicates<br />
a roughly linear event (Figure 5.7)(c), and blue dashed arrow and green dotted-<br />
dashed arrows (Figure 5.7(d)) could be obtained <strong>via</strong> a nonlinear prediction error<br />
filter. These same events are not recoverable <strong>via</strong> a linear prediction error filter.