Soner Bekleric Title of Thesis: Nonlinear Prediction via Volterra Ser
Soner Bekleric Title of Thesis: Nonlinear Prediction via Volterra Ser
Soner Bekleric Title of Thesis: Nonlinear Prediction via Volterra Ser

You also want an ePaper? Increase the reach of your titles
YUMPU automatically turns print PDFs into web optimized ePapers that Google loves.
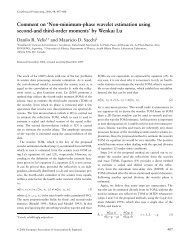
4.2. ANALYSIS OF OPTIMUM FILTER LENGTH 51<br />
I first define the observed data as (D), the noise free data or clean data (Dc) and<br />
the predicted data (Dp) . I now define the following two measures <strong>of</strong> goodness <strong>of</strong><br />
fit:<br />
RMSE1 =<br />
RMSE2 =<br />
<br />
||D − Dp|| 2<br />
nx × nt<br />
<br />
||Dc − Dp|| 2<br />
nx × nt<br />
(4.9)<br />
(4.10)<br />
where nx × nt denotes the dimensions <strong>of</strong> the data: length <strong>of</strong> time series (nx) by<br />
number <strong>of</strong> traces (nt), respectively. RMSE2 is not computable for real cases but<br />
it can be used gain understanding about the problem <strong>of</strong> order selection. The best<br />
(optimum) operator length is given for the operator that minimizes RMSE2 (Fig-<br />
ure 4.1(a)). On the other hand, RMSE1 shows that increasing the filter length leads<br />
to a decrease <strong>of</strong> error that is only accounted by for fitting the noise (Figure 4.1(b)).<br />
In Figure 4.2(a), 2-D synthetic data consisting <strong>of</strong> three linear events yields pre-<br />
dictions for different filter lengths. The signal Dc is contaminated with additive<br />
noise (Figure 4.2(b)) and the signal-to-noise ratio (SNR) has been taken as 4. Figure<br />
4.3(a) corresponds to the prediction <strong>of</strong> data presented in Figure 4.2(b) with param-<br />
eter p = 3. Noise is rejected but the data are also poorly modeled (Figure 4.3(a)).<br />
The prediction <strong>of</strong> linear events in the prediction panel is not satisfactory because<br />
a large amount <strong>of</strong> energy leaks to the noise panel (Figure 4.3(b)). The prediction<br />
with a filter length p = 6 provides good noise rejection and the data is properly<br />
modeled (Figure 4.4(a)). The noise panel contains a small amount <strong>of</strong> coherent en-