KAMDHENU ISPAT LIMITED - Securities and Exchange Board of India
KAMDHENU ISPAT LIMITED - Securities and Exchange Board of India
KAMDHENU ISPAT LIMITED - Securities and Exchange Board of India

Create successful ePaper yourself
Turn your PDF publications into a flip-book with our unique Google optimized e-Paper software.
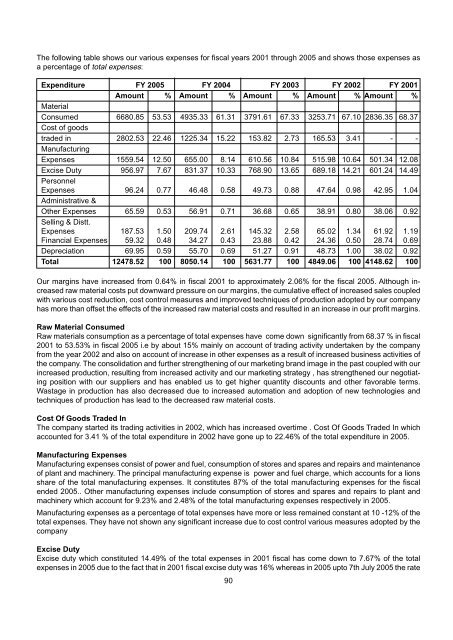
The following table shows our various expenses for fiscal years 2001 through 2005 <strong>and</strong> shows those expenses as<br />
a percentage <strong>of</strong> total expenses:<br />
Expenditure FY 2005 FY 2004 FY 2003 FY 2002 FY 2001<br />
Amount % Amount % Amount % Amount % Amount %<br />
Material<br />
Consumed 6680.85 53.53 4935.33 61.31 3791.61 67.33 3253.71 67.10 2836.35 68.37<br />
Cost <strong>of</strong> goods<br />
traded in 2802.53 22.46 1225.34 15.22 153.82 2.73 165.53 3.41 - -<br />
Manufacturing<br />
Expenses 1559.54 12.50 655.00 8.14 610.56 10.84 515.98 10.64 501.34 12.08<br />
Excise Duty 956.97 7.67 831.37 10.33 768.90 13.65 689.18 14.21 601.24 14.49<br />
Personnel<br />
Expenses 96.24 0.77 46.48 0.58 49.73 0.88 47.64 0.98 42.95 1.04<br />
Administrative &<br />
Other Expenses 65.59 0.53 56.91 0.71 36.68 0.65 38.91 0.80 38.06 0.92<br />
Selling & Distt.<br />
Expenses 187.53 1.50 209.74 2.61 145.32 2.58 65.02 1.34 61.92 1.19<br />
Financial Expenses 59.32 0.48 34.27 0.43 23.88 0.42 24.36 0.50 28.74 0.69<br />
Depreciation 69.95 0.59 55.70 0.69 51.27 0.91 48.73 1.00 38.02 0.92<br />
Total 12478.52 100 8050.14 100 5631.77 100 4849.06 100 4148.62 100<br />
Our margins have increased from 0.64% in fiscal 2001 to approximately 2.06% for the fiscal 2005. Although increased<br />
raw material costs put downward pressure on our margins, the cumulative effect <strong>of</strong> increased sales coupled<br />
with various cost reduction, cost control measures <strong>and</strong> improved techniques <strong>of</strong> production adopted by our company<br />
has more than <strong>of</strong>fset the effects <strong>of</strong> the increased raw material costs <strong>and</strong> resulted in an increase in our pr<strong>of</strong>it margins.<br />
Raw Material Consumed<br />
Raw materials consumption as a percentage <strong>of</strong> total expenses have come down significantly from 68.37 % in fiscal<br />
2001 to 53.53% in fiscal 2005 i.e by about 15% mainly on account <strong>of</strong> trading activity undertaken by the company<br />
from the year 2002 <strong>and</strong> also on account <strong>of</strong> increase in other expenses as a result <strong>of</strong> increased business activities <strong>of</strong><br />
the company. The consolidation <strong>and</strong> further strengthening <strong>of</strong> our marketing br<strong>and</strong> image in the past coupled with our<br />
increased production, resulting from increased activity <strong>and</strong> our marketing strategy , has strengthened our negotiating<br />
position with our suppliers <strong>and</strong> has enabled us to get higher quantity discounts <strong>and</strong> other favorable terms.<br />
Wastage in production has also decreased due to increased automation <strong>and</strong> adoption <strong>of</strong> new technologies <strong>and</strong><br />
techniques <strong>of</strong> production has lead to the decreased raw material costs.<br />
Cost Of Goods Traded In<br />
The company started its trading activities in 2002, which has increased overtime . Cost Of Goods Traded In which<br />
accounted for 3.41 % <strong>of</strong> the total expenditure in 2002 have gone up to 22.46% <strong>of</strong> the total expenditure in 2005.<br />
Manufacturing Expenses<br />
Manufacturing expenses consist <strong>of</strong> power <strong>and</strong> fuel, consumption <strong>of</strong> stores <strong>and</strong> spares <strong>and</strong> repairs <strong>and</strong> maintenance<br />
<strong>of</strong> plant <strong>and</strong> machinery. The principal manufacturing expense is power <strong>and</strong> fuel charge, which accounts for a lions<br />
share <strong>of</strong> the total manufacturing expenses. It constitutes 87% <strong>of</strong> the total manufacturing expenses for the fiscal<br />
ended 2005.. Other manufacturing expenses include consumption <strong>of</strong> stores <strong>and</strong> spares <strong>and</strong> repairs to plant <strong>and</strong><br />
machinery which account for 9.23% <strong>and</strong> 2.48% <strong>of</strong> the total manufacturing expenses respectively in 2005.<br />
Manufacturing expenses as a percentage <strong>of</strong> total expenses have more or less remained constant at 10 -12% <strong>of</strong> the<br />
total expenses. They have not shown any significant increase due to cost control various measures adopted by the<br />
company<br />
Excise Duty<br />
Excise duty which constituted 14.49% <strong>of</strong> the total expenses in 2001 fiscal has come down to 7.67% <strong>of</strong> the total<br />
expenses in 2005 due to the fact that in 2001 fiscal excise duty was 16% whereas in 2005 upto 7th July 2005 the rate<br />
90