KAMDHENU ISPAT LIMITED - Securities and Exchange Board of India
KAMDHENU ISPAT LIMITED - Securities and Exchange Board of India
KAMDHENU ISPAT LIMITED - Securities and Exchange Board of India

Create successful ePaper yourself
Turn your PDF publications into a flip-book with our unique Google optimized e-Paper software.
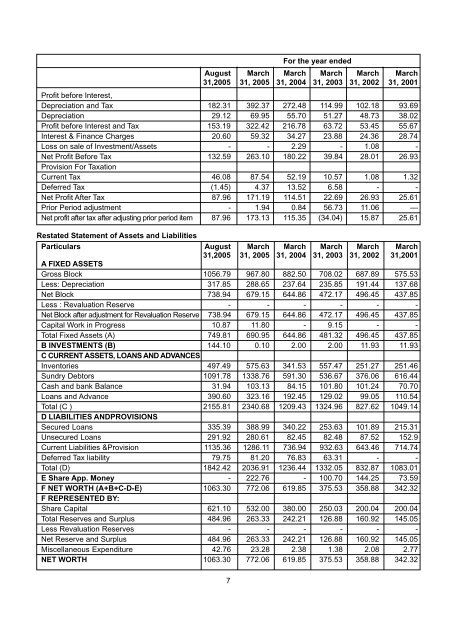
For the year ended<br />
August March March March March March<br />
31,2005 31, 2005 31, 2004 31, 2003 31, 2002 31, 2001<br />
Pr<strong>of</strong>it before Interest,<br />
Depreciation <strong>and</strong> Tax 182.31 392.37 272.48 114.99 102.18 93.69<br />
Depreciation 29.12 69.95 55.70 51.27 48.73 38.02<br />
Pr<strong>of</strong>it before Interest <strong>and</strong> Tax 153.19 322.42 216.78 63.72 53.45 55.67<br />
Interest & Finance Charges 20.60 59.32 34.27 23.88 24.36 28.74<br />
Loss on sale <strong>of</strong> Investment/Assets - - 2.29 - 1.08 -<br />
Net Pr<strong>of</strong>it Before Tax 132.59 263.10 180.22 39.84 28.01 26.93<br />
Provision For Taxation<br />
Current Tax 46.08 87.54 52.19 10.57 1.08 1.32<br />
Deferred Tax (1.45) 4.37 13.52 6.58 - -<br />
Net Pr<strong>of</strong>it After Tax 87.96 171.19 114.51 22.69 26.93 25.61<br />
Prior Period adjustment - 1.94 0.84 56.73 11.06 —<br />
Net pr<strong>of</strong>it after tax after adjusting prior period item 87.96 173.13 115.35 (34.04) 15.87 25.61<br />
Restated Statement <strong>of</strong> Assets <strong>and</strong> Liabilities<br />
Particulars August March March March March March<br />
31,2005 31, 2005 31, 2004 31, 2003 31, 2002 31,2001<br />
A FIXED ASSETS<br />
Gross Block 1056.79 967.80 882.50 708.02 687.89 575.53<br />
Less: Depreciation 317.85 288.65 237.64 235.85 191.44 137.68<br />
Net Block 738.94 679.15 644.86 472.17 496.45 437.85<br />
Less : Revaluation Reserve - - - - - -<br />
Net Block after adjustment for Revaluation Reserve 738.94 679.15 644.86 472.17 496.45 437.85<br />
Capital Work in Progress 10.87 11.80 - 9.15 - -<br />
Total Fixed Assets (A) 749.81 690.95 644.86 481.32 496.45 437.85<br />
B INVESTMENTS (B) 144.10 0.10 2.00 2.00 11.93 11.93<br />
C CURRENT ASSETS, LOANS AND ADVANCES<br />
Inventories 497.49 575.63 341.53 557.47 251.27 251.46<br />
Sundry Debtors 1091.78 1338.76 591.30 536.67 376.06 616.44<br />
Cash <strong>and</strong> bank Balance 31.94 103.13 84.15 101.80 101.24 70.70<br />
Loans <strong>and</strong> Advance 390.60 323.16 192.45 129.02 99.05 110.54<br />
Total (C ) 2155.81 2340.68 1209.43 1324.96 827.62 1049.14<br />
D LIABILITIES ANDPROVISIONS<br />
Secured Loans 335.39 388.99 340.22 253.63 101.89 215.31<br />
Unsecured Loans 291.92 280.61 82.45 82.48 87.52 152.9<br />
Current Liabilities &Provision 1135.36 1286.11 736.94 932.63 643.46 714.74<br />
Deferred Tax liability 79.75 81.20 76.83 63.31 - -<br />
Total (D) 1842.42 2036.91 1236.44 1332.05 832.87 1083.01<br />
E Share App. Money - 222.76 - 100.70 144.25 73.59<br />
F NET WORTH (A+B+C-D-E) 1063.30 772.06 619.85 375.53 358.88 342.32<br />
F REPRESENTED BY:<br />
Share Capital 621.10 532.00 380.00 250.03 200.04 200.04<br />
Total Reserves <strong>and</strong> Surplus 484.96 263.33 242.21 126.88 160.92 145.05<br />
Less Revaluation Reserves - - - - - -<br />
Net Reserve <strong>and</strong> Surplus 484.96 263.33 242.21 126.88 160.92 145.05<br />
Miscellaneous Expenditure 42.76 23.28 2.38 1.38 2.08 2.77<br />
NET WORTH 1063.30 772.06 619.85 375.53 358.88 342.32<br />
7