Vermiculture in Egypt: - FAO - Regional Office for the Near East and
Vermiculture in Egypt: - FAO - Regional Office for the Near East and
Vermiculture in Egypt: - FAO - Regional Office for the Near East and

Create successful ePaper yourself
Turn your PDF publications into a flip-book with our unique Google optimized e-Paper software.
Table 5.2. The ma<strong>in</strong> types of fertilizers used <strong>in</strong> <strong>Egypt</strong><br />
Element Fertilizer<br />
Nitrogen - urea (46.5 percent N)<br />
- ammonium nitrate (33.5 percent N)<br />
- ammonium sulphate (20.6 percent N)<br />
- calcium nitrate (15.5 percent N)<br />
Phosphate - s<strong>in</strong>gle superphosphate (15 percent P 2 O 5 )<br />
- concentrated superphosphate (37 percent P 2 O 5 )<br />
Potassium - potassium sulphate (48 to 50 percent K 2 O)<br />
Mixed <strong>and</strong><br />
compound<br />
fertilizers<br />
Source: <strong>FAO</strong> (2005).<br />
- potassium chloride (50 to 60 percent K 2 O)<br />
-N, P, K, Fe, Mn, Zn <strong>and</strong>/or Cu <strong>in</strong> different <strong>for</strong>mulations <strong>for</strong><br />
ei<strong>the</strong>r soil or foliar application. The micronutrient may be <strong>in</strong><br />
ei<strong>the</strong>r m<strong>in</strong>eral or chelated <strong>for</strong>m.<br />
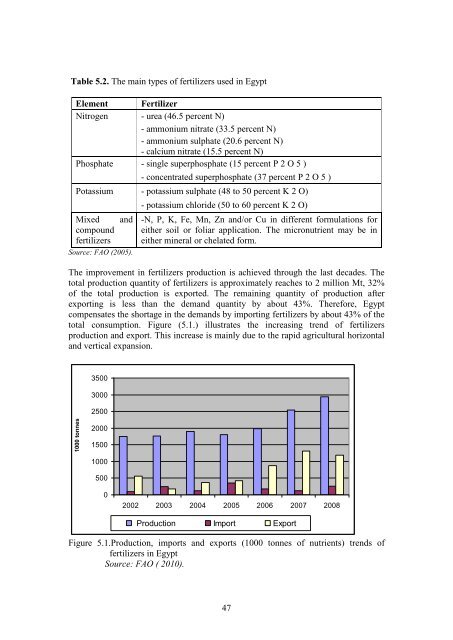
The improvement <strong>in</strong> fertilizers production is achieved through <strong>the</strong> last decades. The<br />
total production quantity of fertilizers is approximately reaches to 2 million Mt, 32%<br />
of <strong>the</strong> total production is exported. The rema<strong>in</strong><strong>in</strong>g quantity of production after<br />
export<strong>in</strong>g is less than <strong>the</strong> dem<strong>and</strong> quantity by about 43%. There<strong>for</strong>e, <strong>Egypt</strong><br />
compensates <strong>the</strong> shortage <strong>in</strong> <strong>the</strong> dem<strong>and</strong>s by import<strong>in</strong>g fertilizers by about 43% of <strong>the</strong><br />
total consumption. Figure (5.1.) illustrates <strong>the</strong> <strong>in</strong>creas<strong>in</strong>g trend of fertilizers<br />
production <strong>and</strong> export. This <strong>in</strong>crease is ma<strong>in</strong>ly due to <strong>the</strong> rapid agricultural horizontal<br />
<strong>and</strong> vertical expansion.<br />
1000 tonnes<br />
3500<br />
3000<br />
2500<br />
2000<br />
1500<br />
1000<br />
500<br />
0<br />
2002 2003 2004 2005 2006 2007 2008<br />
Production Import Export<br />
Figure 5.1.Production, imports <strong>and</strong> exports (1000 tonnes of nutrients) trends of<br />
fertilizers <strong>in</strong> <strong>Egypt</strong><br />
Source: <strong>FAO</strong> ( 2010).<br />
47