Vermiculture in Egypt: - FAO - Regional Office for the Near East and
Vermiculture in Egypt: - FAO - Regional Office for the Near East and
Vermiculture in Egypt: - FAO - Regional Office for the Near East and

You also want an ePaper? Increase the reach of your titles
YUMPU automatically turns print PDFs into web optimized ePapers that Google loves.
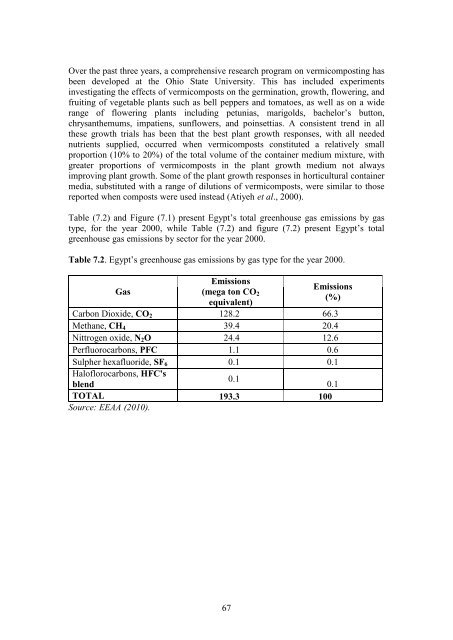
Over <strong>the</strong> past three years, a comprehensive research program on vermicompost<strong>in</strong>g has<br />
been developed at <strong>the</strong> Ohio State University. This has <strong>in</strong>cluded experiments<br />
<strong>in</strong>vestigat<strong>in</strong>g <strong>the</strong> effects of vermicomposts on <strong>the</strong> germ<strong>in</strong>ation, growth, flower<strong>in</strong>g, <strong>and</strong><br />
fruit<strong>in</strong>g of vegetable plants such as bell peppers <strong>and</strong> tomatoes, as well as on a wide<br />
range of flower<strong>in</strong>g plants <strong>in</strong>clud<strong>in</strong>g petunias, marigolds, bachelor‟s button,<br />
chrysan<strong>the</strong>mums, impatiens, sunflowers, <strong>and</strong> po<strong>in</strong>settias. A consistent trend <strong>in</strong> all<br />
<strong>the</strong>se growth trials has been that <strong>the</strong> best plant growth responses, with all needed<br />
nutrients supplied, occurred when vermicomposts constituted a relatively small<br />
proportion (10% to 20%) of <strong>the</strong> total volume of <strong>the</strong> conta<strong>in</strong>er medium mixture, with<br />
greater proportions of vermicomposts <strong>in</strong> <strong>the</strong> plant growth medium not always<br />
improv<strong>in</strong>g plant growth. Some of <strong>the</strong> plant growth responses <strong>in</strong> horticultural conta<strong>in</strong>er<br />
media, substituted with a range of dilutions of vermicomposts, were similar to those<br />
reported when composts were used <strong>in</strong>stead (Atiyeh et al., 2000).<br />
Table (7.2) <strong>and</strong> Figure (7.1) present <strong>Egypt</strong>‟s total greenhouse gas emissions by gas<br />
type, <strong>for</strong> <strong>the</strong> year 2000, while Table (7.2) <strong>and</strong> figure (7.2) present <strong>Egypt</strong>‟s total<br />
greenhouse gas emissions by sector <strong>for</strong> <strong>the</strong> year 2000.<br />
Table 7.2. <strong>Egypt</strong>‟s greenhouse gas emissions by gas type <strong>for</strong> <strong>the</strong> year 2000.<br />
Gas<br />
Emissions<br />
(mega ton CO2<br />
equivalent)<br />
67<br />
Emissions<br />
(%)<br />
Carbon Dioxide, CO2 128.2 66.3<br />
Methane, CH4 39.4 20.4<br />
Nittrogen oxide, N2O 24.4 12.6<br />
Perfluorocarbons, PFC 1.1 0.6<br />
Sulpher hexafluoride, SF6 0.1 0.1<br />
Haloflorocarbons, HFC's<br />
blend<br />
0.1<br />
0.1<br />
TOTAL<br />
Source: EEAA (2010).<br />
193.3 100