Hi-Res PDF - CRCnetBASE
Hi-Res PDF - CRCnetBASE
Hi-Res PDF - CRCnetBASE

Create successful ePaper yourself
Turn your PDF publications into a flip-book with our unique Google optimized e-Paper software.
252<br />
asingle look up table representing the two draft gear springs in series and then tuning draft gear<br />
modelparameters to suit adraft gear pair.The slack element can be added either in the look up table<br />
or added in series.Different parameterscan be chosenfor loading and unloadingcurves. The small<br />
kick in the unloading curve is observed in some test data. The dynamicist can also implement<br />
slightly different values of, f , V f , m s and m k for the unloading curve if required toobtain agood fit<br />
to the experimental data.<br />
There is always room for debate as to whether acomplex model asdescribed here is justified<br />
whencomparedtothe simpler yetdetailed work by Duncan and Webb. 1 Theuser may decide on the<br />
complexity of the model according to the purpose and accuracy required for the simulation studies<br />
being completed. While the wedge friction model adjusts for different impact conditions, its use is<br />
really justified for simulations where these conditions are expected to vary. The use of the wedge<br />
model for the unloading curve is an area where asimple lookup table may suffice, as it is only<br />
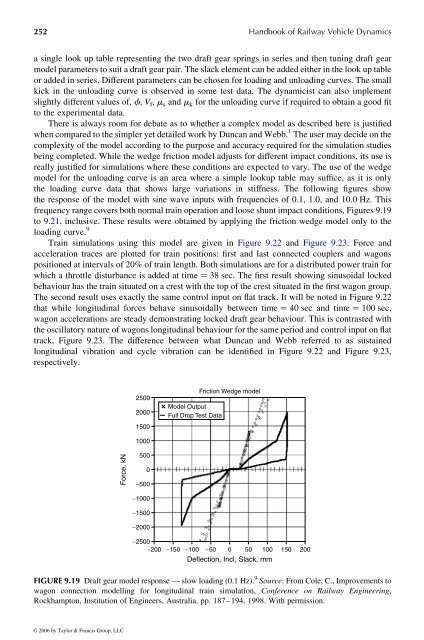
the loading curve data that shows large variations in stiffness. The following figures show<br />
the response of the model with sine wave inputs with frequencies of 0.1, 1.0, and 10.0 Hz. This<br />
frequencyrange covers both normal train operation and loose shunt impact conditions, Figures 9.19<br />
to 9.21, inclusive. These results were obtained byapplying the friction wedge model only to the<br />
loading curve. 9<br />
Train simulations using this model are given in Figure 9.22 and Figure 9.23. Force and<br />
acceleration traces are plotted for train positions: first and last connected couplers and wagons<br />
positioned at intervals of 20% of train length. Both simulations are for adistributed powertrain for<br />
which athrottle disturbance is added at time ¼ 38 sec. The first result showing sinusoidal locked<br />
behaviourhas the train situated on acrest with the top of the crest situated in the first wagon group.<br />
The second result uses exactly the same control input on flat track. It will be noted inFigure 9.22<br />
that while longitudinal forces behave sinusoidally between time ¼ 40 sec and time ¼ 100 sec,<br />
wagon accelerations are steady demonstrating locked draft gear behaviour. This is contrasted with<br />
the oscillatory nature of wagons longitudinal behaviour for the sameperiod and control input on flat<br />
track, Figure 9.23. The difference between what Duncan and Webb referred to as sustained<br />
longitudinal vibration and cycle vibration can be identified in Figure 9.22 and Figure 9.23,<br />
respectively.<br />
Force, kN<br />
2500<br />
2000<br />
1500<br />
1000<br />
500<br />
0<br />
- 500<br />
- 1000<br />
- 1500<br />
- 2000<br />
Model Output<br />
Full Drop Test Data<br />
Friction Wedge model<br />
- 2500<br />
- 200 - 150 - 100 - 50 0 50 100 150 200<br />
Deflection, Incl, Slack, mm<br />
Handbook of Railway Vehicle Dynamics<br />
FIGURE 9.19 Draft gear model response —slow loading (0.1 Hz). 9 Source:From Cole, C., Improvements to<br />
wagon connection modelling for longitudinal train simulation, Conference on Railway Engineering,<br />
Rockhampton, Institution of Engineers, Australia, pp. 187–194, 1998. With permission.<br />
© 2006 by Taylor & Francis Group, LLC