Hi-Res PDF - CRCnetBASE
Hi-Res PDF - CRCnetBASE
Hi-Res PDF - CRCnetBASE

You also want an ePaper? Increase the reach of your titles
YUMPU automatically turns print PDFs into web optimized ePapers that Google loves.
246<br />
Force, MN<br />
2.5<br />
2<br />
1.5<br />
1<br />
0.5<br />
Unit 1 Unit 2<br />
0<br />
0 20 40 60 80<br />
Deflection, mm<br />
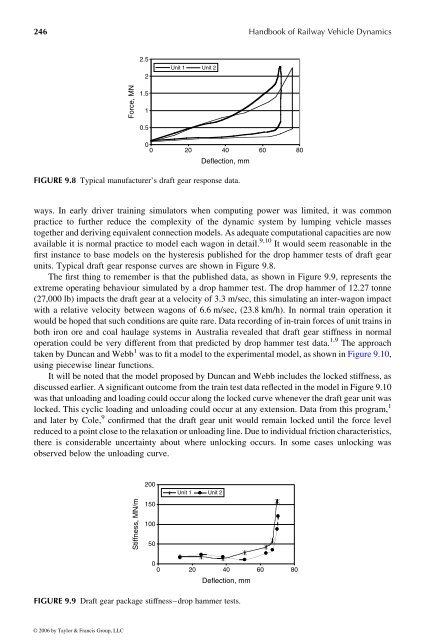
FIGURE 9.8 Typical manufacturer’s draft gear response data.<br />
ways. In early driver training simulators when computing power was limited, it was common<br />
practice to further reduce the complexity of the dynamic system by lumping vehicle masses<br />
together and deriving equivalent connection models. As adequate computational capacities are now<br />
available it is normal practice to model each wagon in detail. 9,10 It would seem reasonable in the<br />
first instance to base models on the hysteresis published for the drop hammer tests of draft gear<br />
units. Typical draft gear response curves are shown inFigure 9.8.<br />
The first thing to remember is that the published data, asshown inFigure 9.9, represents the<br />
extreme operating behaviour simulated by adrop hammer test. The drop hammer of12.27 tonne<br />
(27,000 lb) impacts the draft gear at avelocity of 3.3 m/sec, this simulating an inter-wagon impact<br />
with arelative velocity between wagons of 6.6 m/sec, (23.8 km/h). In normal train operation it<br />
would be hoped that such conditionsare quite rare. Data recording of in-train forces of unit trains in<br />
both iron ore and coal haulage systems inAustralia revealed that draft gear stiffness in normal<br />
operation could be very different from that predicted by drop hammer test data. 1,9 The approach<br />
taken by Duncan and Webb 1 was to fit amodeltothe experimental model, as showninFigure9.10,<br />
using piecewise linear functions.<br />
It will be noted that the model proposed by Duncan and Webb includes the locked stiffness, as<br />
discussedearlier. Asignificant outcome from the train test data reflected in the modelinFigure9.10<br />
was that unloading and loading couldoccur along the locked curve whenever the draftgear unit was<br />
locked. This cyclic loading and unloading could occur at any extension. Data from this program, 1<br />
and later by Cole, 9 confirmed that the draft gear unit would remain locked until the force level<br />
reduced to apoint closetothe relaxation or unloading line. Due to individual friction characteristics,<br />
there is considerable uncertainty about where unlocking occurs. In some cases unlocking was<br />
observed below the unloading curve.<br />
Stiffness, MN/m<br />
200<br />
150<br />
100<br />
50<br />
Unit 1 Unit 2<br />
0<br />
0 20 40 60 80<br />
Deflection, mm<br />
FIGURE 9.9 Draft gear package stiffness–drop hammer tests.<br />
© 2006 by Taylor & Francis Group, LLC<br />
Handbook of Railway Vehicle Dynamics