Hi-Res PDF - CRCnetBASE
Hi-Res PDF - CRCnetBASE
Hi-Res PDF - CRCnetBASE

Create successful ePaper yourself
Turn your PDF publications into a flip-book with our unique Google optimized e-Paper software.
256<br />
TractionForce, kN<br />
450<br />
400<br />
350<br />
300<br />
250<br />
200<br />
150<br />
100<br />
50<br />
0<br />
0 20 40 60 80 100<br />
Velocity, kph<br />
Notch =2<br />
Notch =4<br />
Notch =6<br />
Notch =8<br />
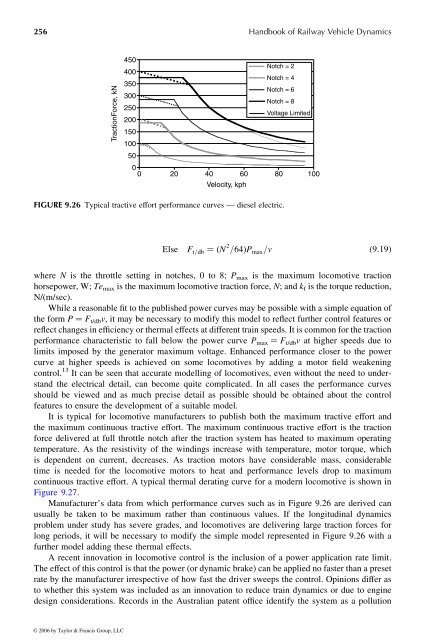
FIGURE 9.26 Typical tractive effort performance curves —diesel electric.<br />
Handbook of Railway Vehicle Dynamics<br />
Voltage Limited<br />
Else F t = db ¼ðN 2 = 64Þ P max= v ð 9 : 19Þ<br />
where N is the throttle setting in notches, 0to8; P max is the maximum locomotive traction<br />
horsepower, W; Temax is the maximum locomotive traction force, N ;and k f is the torque reduction,<br />
N/(m/sec).<br />
While areasonablefittothe publishedpower curves may be possible with asimpleequation of<br />
the form P ¼ F t/dbv ,itmay be necessary to modify this model toreflect further control features or<br />
reflectchanges in efficiency or thermal effects at different train speeds. It is common for the traction<br />
performance characteristic to fall below the power curve P max ¼ F t/dbv at higher speeds due to<br />
limits imposed bythe generator maximum voltage. Enhanced performance closer to the power<br />
curve at higher speeds is achieved on some locomotives by adding amotor field weakening<br />
control. 13 It can be seen that accurate modelling of locomotives, even without the need to understand<br />
the electrical detail, can become quite complicated. In all cases the performance curves<br />
should beviewed and as much precise detail as possible should be obtained about the control<br />
features to ensure the development of asuitable model.<br />
It is typical for locomotive manufacturers to publish both the maximum tractive effort and<br />
the maximum continuous tractive effort. The maximum continuous tractive effort is the traction<br />
force delivered at full throttle notch after the traction system has heated to maximum operating<br />
temperature. As the resistivity of the windings increase with temperature, motor torque, which<br />
is dependent on current, decreases. As traction motors have considerable mass, considerable<br />
time is needed for the locomotive motors to heat and performance levels drop to maximum<br />
continuous tractive effort. Atypical thermal derating curve for amodern locomotive isshown in<br />
Figure 9.27.<br />
Manufacturer’s data from which performance curves such as in Figure 9.26 are derived can<br />
usually be taken to be maximum rather than continuous values. If the longitudinal dynamics<br />
problem under study has severe grades, and locomotives are delivering large traction forces for<br />
long periods, it will be necessary to modify the simple model represented in Figure 9.26 with a<br />
further model adding these thermal effects.<br />
Arecent innovation in locomotive control is the inclusion of apower application rate limit.<br />
The effect of this control is that the power (or dynamic brake) can be applied no faster than apreset<br />
rate by the manufacturer irrespective of how fast the driver sweeps the control. Opinions differ as<br />
to whether this system was included as an innovation to reduce train dynamics ordue to engine<br />
design considerations. Records inthe Australian patent office identify the system as apollution<br />
© 2006 by Taylor & Francis Group, LLC