Hi-Res PDF - CRCnetBASE
Hi-Res PDF - CRCnetBASE
Hi-Res PDF - CRCnetBASE

Create successful ePaper yourself
Turn your PDF publications into a flip-book with our unique Google optimized e-Paper software.
Longitudinal Train Dynamics 257<br />
Traction Force, kN<br />
500<br />
400<br />
300<br />
200<br />
100<br />
0<br />
0 50 100 150 200<br />
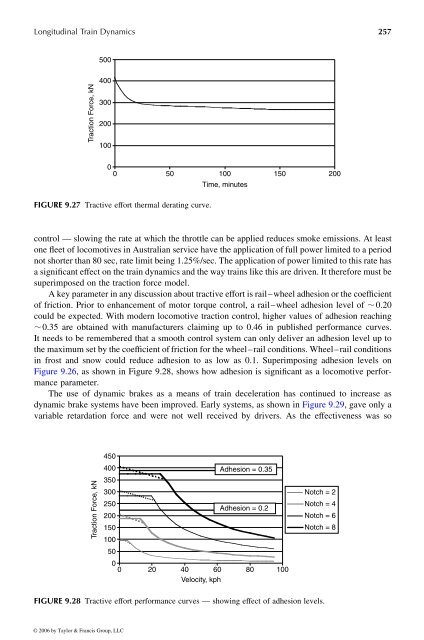
FIGURE 9.27 Tractive effort thermal derating curve.<br />
Time, minutes<br />
control —slowing the rate at which the throttle can be applied reduces smoke emissions. At least<br />
one fleet of locomotives in Australian service have the application of full power limited to aperiod<br />
not shorter than 80 sec, rate limit being 1.25%/sec. The applicationofpower limited to this rate has<br />
asignificant effect on the train dynamics and the way trains like this are driven. It therefore must be<br />
superimposed on the traction force model.<br />
Akey parameter in any discussion about tractive effort is rail–wheel adhesion or the coefficient<br />
of friction. Prior toenhancement of motor torque control, arail–wheel adhesion level of , 0.20<br />
could be expected. With modern locomotive traction control, higher values of adhesion reaching<br />
, 0.35 are obtained with manufacturers claiming up to 0.46 in published performance curves.<br />
It needs to be remembered that asmooth control system can only deliver an adhesion level up to<br />
the maximum set by the coefficient of friction for the wheel–rail conditions. Wheel–rail conditions<br />
in frost and snow could reduce adhesion to as low as 0.1. Superimposing adhesion levels on<br />
Figure 9.26, asshown in Figure 9.28, shows how adhesion is significant as alocomotive performance<br />
parameter.<br />
The use of dynamic brakes asameans of train deceleration has continued to increase as<br />
dynamic brake systems have been improved. Early systems, as shown in Figure 9.29, gave only a<br />
variable retardation force and were not well received bydrivers. As the effectiveness was so<br />
Traction Force, kN<br />
450<br />
400<br />
350<br />
300<br />
250<br />
200<br />
150<br />
100<br />
50<br />
0<br />
Adhesion =0.35<br />
Adhesion =0.2<br />
0 20 40 60 80 100<br />
Velocity, kph<br />
Notch =2<br />
Notch =4<br />
Notch =6<br />
Notch =8<br />
FIGURE 9.28 Tractive effort performance curves —showing effect of adhesion levels.<br />
© 2006 by Taylor & Francis Group, LLC