Paper_Clip_Tutorial Part1.pdf - GaBi Software
Paper_Clip_Tutorial Part1.pdf - GaBi Software
Paper_Clip_Tutorial Part1.pdf - GaBi Software

You also want an ePaper? Increase the reach of your titles
YUMPU automatically turns print PDFs into web optimized ePapers that Google loves.
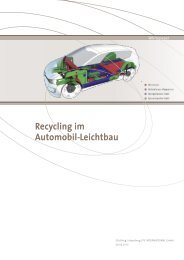
3.0E-11<br />
2.5E-11<br />
2.0E-11<br />
1.5E-11<br />
1.0E-11<br />
5.0E-12<br />
0.0E+00<br />
GWP 100<br />
Year [-]<br />
Conducting Life Cycle Assessments<br />
2001 with the characterization factor from December 2007. Methane contributes to the<br />
global warming potential (GWP). Therefore, during the classification step, methane is<br />
classified as a contributor to the global warming potential impact category. According to<br />
the CML method, methane has a characterization factor of 25. This means that CML has<br />
determined that methane contributes 25 times more than carbon dioxide to the global<br />
warming potential when a time frame of a hundred years is taken into account. The 6 kg of<br />
CH4-emissions in this example contribute 150 kg CO2-equivalents<br />
to the total GWP.<br />
2.3.5 Optional elements of an LCA<br />
Normalization, evaluation, grouping and weighting are all optional elements that are<br />
performed to facilitate the interpretation of the LCIA results. It is essential that these<br />
actions are transparently documented since other individuals, organizations and societies<br />
may have different preferences for displaying the results and might want to normalize,<br />
evaluate, group or weight them differently.<br />
2.3.5.1 Normalization<br />
Normalization involves displaying the magnitude of impact indicator results relative to a<br />
reference amount. For example this can be done for comparison with a reference system.<br />
The impact potentials quantify the potential for specific ecological impacts. In the<br />
normalization step the impact category results are compared to references in order to<br />
distinguish what is normal or not. For the normalization, reference quantities for a<br />
reference region or country (e.g. Germany) during a time period (e.g. 1 year) are used.<br />
This could be, for example, the overall emission of CO2-equivalents in Germany within<br />
one year, or, the CO2-equivalents of one person in Western Europe per year. When the<br />
results of all impact categories are compared to their references, they can be compared to<br />
each other more easily, since it is possible to say which impact indicator result contributes<br />
more or less to the overall entity of this impact category.<br />
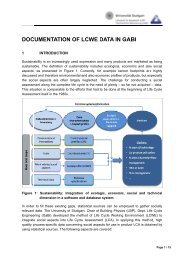
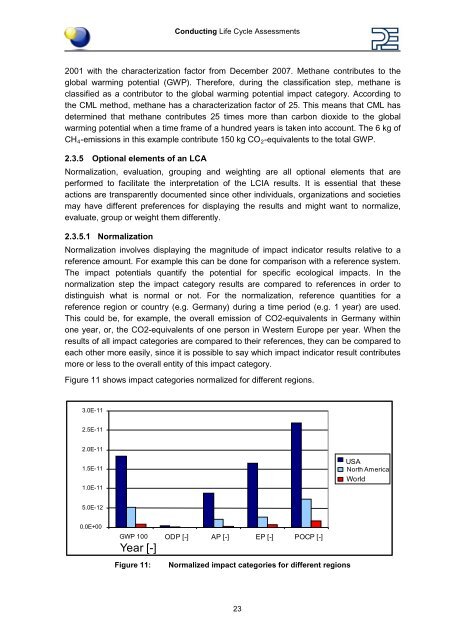
Figure 11 shows impact categories normalized for different regions.<br />
ODP [-] AP [-] EP [-] POCP [-]<br />
Figure 11: Normalized impact categories for different regions<br />
23<br />
USA<br />
North America<br />
World