Transactions
Transactions
Transactions

You also want an ePaper? Increase the reach of your titles
YUMPU automatically turns print PDFs into web optimized ePapers that Google loves.
484 TRANSACTIONS OF TH E A.S.M.E. AUGUST, 1941<br />
rate of burning per foot of length of tuyere stack, divided by the<br />
depth of the fuel bed over the burning lane, i.e., the height of<br />
that boundary. An average value of the last-mentioned quantity<br />
representing the entire fuel bed cannot be estimated accurately,<br />
but Table 2 shows that the calculated values are comparable with<br />
those estimated from the motion pictures.<br />
The transverse motion of the fuel from the retort toward the<br />
center line of the tuyere stack is terminated when the fuel mass<br />
breaks off from the wall of the burning lane. Such detached<br />
masses then fall vertically downward into the lane and help to<br />
T A B L E 2<br />
T R A N S V E R S E V E L O C IT IE S O F F L O W O F F U E L<br />
Fire condition<br />
Long pusher strokes at load of 125,000 lb<br />
per h r..............................................................<br />
Average...............................................................<br />
Probable error....................................................<br />
Fhort pusher strokes at load of 119,000 lb<br />
per h r..............................................................<br />
Average...........<br />
Probable error.<br />
Observed values,<br />
fph<br />
1.85<br />
0.81<br />
1.33<br />
— 0.34<br />
0.72<br />
0.67<br />
1.85<br />
— 1.18<br />
1.45<br />
0.68<br />
0.22<br />
1.06<br />
— 1.25<br />
1.76<br />
0.70<br />
0.96<br />
1.83<br />
0.65<br />
1.26<br />
0.70<br />
0.51<br />
0.55<br />
0.94<br />
1.38<br />
— 0.42<br />
0.52<br />
0.75<br />
0.14<br />
Calculated,<br />
fph<br />
form the continuous bed of discrete particles which exists at the<br />
bottom of the lane. On the burning lane itself the motion of the<br />
fuel is downward, just as in any other overfeed bed and, just as<br />
in an overfeed bed, the size of the particles decreases as they fall<br />
lower in the bed.<br />
At this point a mysterious situation exists. Eventually practically<br />
all of the fuel is burned out and at the bottom of the bed<br />
ash will be collected, perhaps in a dry, powdery form if the cooling<br />
effect of the air is great enough, or perhaps as small clinkers.<br />
Somehow or other a large portion of this ash gets down to the ashpit,<br />
but so far the path by which it reaches that destination has<br />
not been discovered. During the Hell Gate tests, it wras sometimes<br />
found that a layer of ash existed along the tops of the<br />
tuyeres. When this occurred, opening the guide tubes preparatory<br />
to inserting a probe was followed by a shower of ash blown down<br />
65<br />
through the tubes, but in an equal number of cases no ash came<br />
down and the probes read high temperatures right at the level<br />
of the tuyeres. Is the agitation of the incoming air sufficient to<br />
cause the ash to flow along the slope of the tuyfire stacks down<br />
to the ashpit? This seems hardly likely and yet the only other<br />
alternative, that all of the ash is blown up through the burning<br />
lane and then dropped out of the air stream when it slows down<br />
in the furnace, seems still more unlikely. Thus, there remains a<br />
hiatus in our knowledge of the flow of solid materials in the fuel<br />
bed.<br />
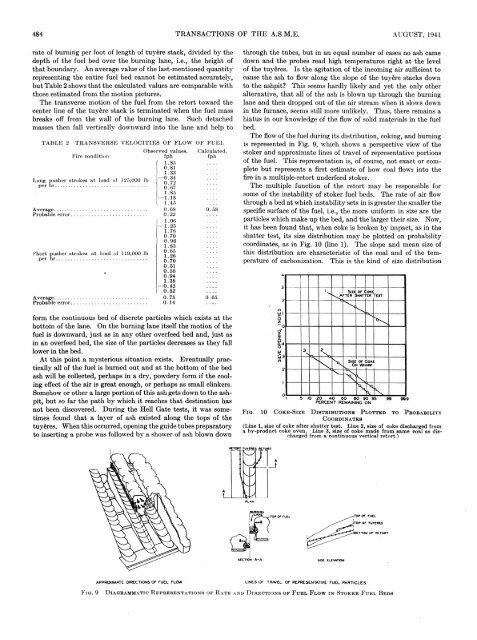
The flow of the fuel during its distribution, coking, and burning<br />
is represented in Fig. 9, which shows a perspective view of the<br />
stoker and approximate lines of travel of representative portions<br />
of the fuel. This representation is, of course, not exact or complete<br />
but represents a first estimate of how coal flows into the<br />
fire in a multiple-retort underfeed stoker.<br />
The multiple function of the retort may be responsible for<br />
some of the instability of stoker fuel beds. The rate of air flow<br />
through a bed at which instability sets in is greater the smaller the<br />
specific surface of the fuel, i.e., the more uniform in size are the<br />
particles which make up the bed, and the larger their size. Now,<br />
it has been found that, when coke is broken by impact, as in the<br />
shatter test, its size distribution may be plotted on probability<br />
coordinates, as in Fig. 10 (line 1). The slope and mean size of<br />
this distribution are characteristic of the coal and of the temperature<br />
of carbonization. This is the kind of size distribution<br />
Fia. 10 C o k e -Size D i s t r i b u t i o n s P l o t t e d t o P r o b a b i l i t y<br />
C o o r d i n a t e s<br />
(Line X, size of coke after shatter test. Line 2, size of coke discharged from<br />
a by-product coke oven. Line 3, size of coke made from same ooal as discharged<br />
from a continuous vertical retort.)<br />
APPROXIMATE DIRECTIONS OF FUEL FLOW<br />
LINES OF TRAVEL OF REPRESENTATIVE FUEL P A R T IC L E S<br />
F i g . 9 D i a g r a m m a t i c R e p r e s e n t a t i o n s o f R a t e a n d D i r e c t i o n s o f F u e l F l o w i n S t o k e r F u e l B e d s