Transactions
Transactions
Transactions

You also want an ePaper? Increase the reach of your titles
YUMPU automatically turns print PDFs into web optimized ePapers that Google loves.
The Bureau of Standards paper2 gives the integration and solution<br />
of this equation for several special conditions, of which only<br />
two are of interest to us: The behavior of a body (bulb) immersed<br />
into another body (bath) of constant temperature, and of a<br />
temperature rising at a uniform rate.<br />
The equation for the constant temperature is<br />
Written in logarithmic form, Equation |2] becomes<br />
BECK—TH ERM O M ETRIC T IM E LAG 537<br />
which is the form used in the main paper. Solved for L, this<br />
formula permits the determination of L from any two timed<br />
temperature readings<br />
I t will be noted that with —-----— = e the formula becomes<br />
T — 2 2<br />
L = s, which is the relation on which the recommended method<br />
of measuring time lag is based.<br />
The equations for the steady-rising bath are as follows<br />
S E C O N D S<br />
F i g . 1 0 C o m p a r i s o n o f T h e r m o m e t e r R e s p o n s e f o r S u d d e n<br />
B u l b T r a n s f e r (A ) a n d U n i f o r m R a t e o f T e m p e r a t u r e R i s e<br />
(B)<br />
The condition shown by the curve, Fig. 2, is based on T0 =<br />
Th in which case Equation [6] becomes<br />
The term rse S/ L becomes increasingly smaller with time so<br />
that the thermometer finally approaches the condition<br />
In equation [8], the temperature lag T — T* eventually will<br />
equal the rate of temperature change times the time lag. Fig. 2<br />
shows rL as a dash line and illustrates the gradual approach of<br />
the bulb temperature to this line.<br />
Appendix— 2<br />
In the main part of the paper there has been no discussion of<br />
the events which occur immediately after transferring a thermometer<br />
bulb from one temperature medium into another one at<br />
higher or lower temperature. The author felt that they were of<br />
no concern to the practical engineer for whom the paper is intended.<br />
The methods proposed for determining the time lag were<br />
deliberately arranged to eliminate the effects caused by the sudden<br />
contact of the bulb with a medium at a considerably different<br />
temperature.<br />
In a preliminary discussion3 of the paper, the question was<br />
brought up whether in the theory of temperature regulators the<br />
time lag as discussed in the main paper, or that for “sudden bulb<br />
contact” would have to be considered. Fig. 1 shows the tem <br />
perature curve without the “sudden contact” effect; Fig 10, curve<br />
A, shows an actual temperature-response type with a drop at the<br />
beginning, which is due to the sudden contact of the bulb with<br />
hot water. The reason for the drop is as follows: The heat<br />
proceeds like a wave from the bulb surface to the interior. During<br />
1 Annual Meeting, Philadelphia, Pa., December 4 - 8 , 1 9 3 9 , o f T h e<br />
A m e r i c a n S o c i e t y o p M e c h a n i c a l E n g i n e e r s .<br />
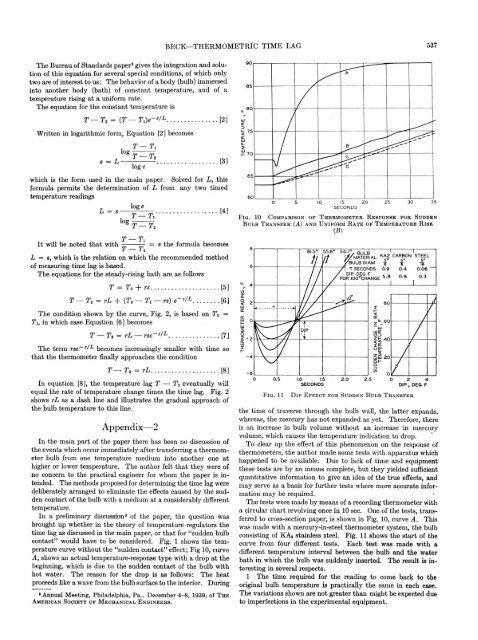
F i g . 11<br />
D i p E f f e c t f o r S u d d e n B u l b T r a n s f e r<br />
the time of traverse through the bulb wall, the latter expands,<br />
whereas, the mercury has not expanded as yet. Therefore, there<br />
is an increase in bulb volume without an increase in mercury<br />
volume, which causes the temperature indication to drop.<br />
To clear up the effect of this phenomenon on the response of<br />
thermometers, the author made some tests with apparatus which<br />
happened to be available. Due to lack of time and equipment<br />
these tests are by no means complete, but they yielded sufficient<br />
quantitative information to give an idea of the true effects, and<br />
may serve as a basis for further tests where more accurate information<br />
may be required.<br />
The tests were made by means of a recording thermometer with<br />
a circular chart revolving once in 10 sec. One of the tests, transferred<br />
to cross-section paper, is shown in Fig. 10, curve A . This<br />
was made with a mercury-in-steel thermometer system, the bulb<br />
consisting of KA2 stainless steel. Fig. 11 shows the start of the<br />
curve from four different tests. Each test was made with a<br />
different temperature interval between the bulb and the water<br />
bath in which the bulb was suddenly inserted. The result is interesting<br />
in several respects.<br />
1 The time required for the reading to come back to the<br />
original bulb temperature is practically the same in each case.<br />
The variations shown are not greater than might be expected due<br />
to imperfections in the experimental equipment.