Transactions
Transactions
Transactions

Create successful ePaper yourself
Turn your PDF publications into a flip-book with our unique Google optimized e-Paper software.
548 TRANSACTIONS OF TH E A.S.M.E. AUGUST, 1941<br />
T A B L E 1 R U N S O N B O IL IN G BEN ZEN E®<br />
(Steam used in all twelve jackets in all runs)**<br />
Start of<br />
boiling<br />
section,<br />
Start of<br />
superheating<br />
section,<br />
W eight<br />
Feed Feed Steam<br />
H eatc Inlet Outlet per cent<br />
Pressure<br />
R un rate, temp, pressure, transfer, velocity, velocity, of feed per cent per cent drop,<br />
no. lb per hr C psi gage B tu per hr fps fps vaporized of jacket of jacket cm Hg<br />
B-6 1010 54.5 114.0 136000 0.94 175 66 20 of J 2 20.1<br />
B-3 990 52.5 108.0 161000 0.92 220 82 10 of J 2 24.4<br />
B-2 906 45.0 12.7 183000 0.84 240 100 10 of J 2 50 of J 12 37.4<br />
B-4 1080 55.8 1.9 149000 1.00 185 66 90 of J 3 20.8<br />
B-7A 1030 58.5 2.1 146000 0.95 190 73 70 of J 3<br />
B - ll 818 50.5 64.0 141000 0.76 190 87 60 of J 1 23.0<br />
B-10 689 44.5 34.0 152000 0.64 200 100 50 of J 1 60 of J 9 26.7<br />
B-9 710 45.0 28.0 157000 0.66 210 100 50 of J 1 10 of J 8 32.0<br />
B-8 750 45.7 13.4 157000 0.69 205 100 E nd of J 1 50 of J 10 33.2<br />
B-l 615 42.5 1.5 125000 0.57 170 100 40 of J 2 50 of J 12 20.2<br />
B-5 650 47.0 1.5 122000 0.60 165 96 95 of J 2 17.4<br />
B-7 700 45.5 1.2 127000 0.65 170 91 10 of J 3 17.4<br />
B-14 713 44.0 1.1 124000 0.66 160 85 60 of J 3 18.0<br />
B-1A 704 47.5 1.6 129000 0.65 165 91 10 of J 3 20.9<br />
B-4A 674 51.5 1.7 127000 0.62 180 100 80 of J 2 90 of J 12 19.6<br />
B-6A 720 48.0 2.1 131000 0.67 175 92 E nd of J 2 19.1<br />
B-12 448 45.5 74.0 87000 0.42 120 98 70 of J 1 9.3<br />
B-2A 434 41.0 1.6 91000 0.40 120 100 20 of J 2 40 of J 9 11.7<br />
B-5A 453 46.0 1.8 92000 0.42 130 100 30 of J 2 70 of J 9 12.3<br />
B-13 289 37.5 70.0 60000 0.27 80 100 70 of J 1 70 of J 12 4.6<br />
B-3A 282 36.0 1.8 60000 0.26 81 100 80 of J 1 10 of J 6 5.7<br />
° Refer to Bibliography (6).<br />
b Inside heated area of copper pipe = 0.88 sq ft per jacket.<br />
c Based on steam-condensate measurements.<br />
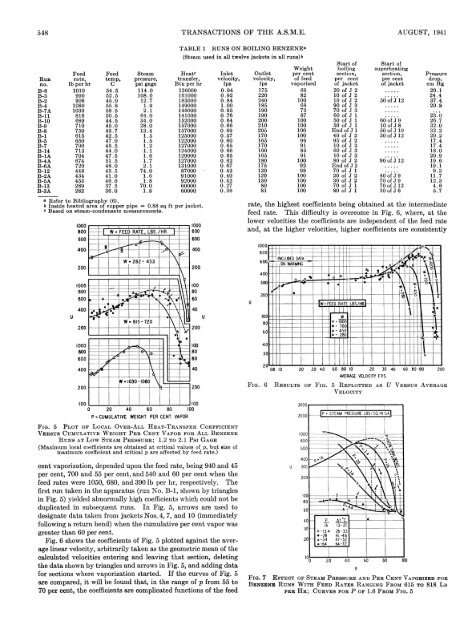
rate, the highest coefficients being obtained at the intermediate<br />
feed rate. This difficulty is overcome in Fig. 6, where, at the<br />
lower velocities the coefficients are independent of the feed rate<br />
and, at the higher velocities, higher coefficients are consistently<br />
F i g . 6<br />
R e s u l t s o f F i g . 5 R e p l o t t e d a s U V e r s u s A v e r a g e<br />
V e l o c i t y<br />
F i g . 5<br />
P - CUMULATIVE WEIGHT PER CENT VAPOR<br />
P l o t o f L o c a l O v e r - A l l H e a t - T r a n s f e r C o e f f i c i e n t<br />
V e r s u s C u m u l a t i v e W e i g h t P e r C e n t V a p o r f o r A l l B e n z e n e<br />
R u n s a t L o w S t e a m P r e s s u r e ; 1 .2 t o 2 .1 Psi G a g e<br />
(M a x im u m lo c a l co efficien ts are o b ta in e d a t c r itic a l v a lu e s of p, b u t siz e of<br />
m a x im u m coefficien t a n d c r itic a l p are a ffe cte d b y fe e d r a te .)<br />
cent vaporization, depended upon the feed rate, being 940 and 45<br />
per cent, 700 and 55 per cent, and 540 and 60 per cent when the<br />
feed rates were 1050, 680, and 390 lb per hr, respectively. The<br />
first run taken in the apparatus (run No. B-l, shown by triangles<br />
in Fig. 5) yielded abnormally high coefficients which could not be<br />
duplicated in subsequent runs. In Fig. 5, arrows are used to<br />
designate data taken from jackets Nos. 4, 7, and 10 (immediately<br />
following a return bend) when the cumulative per cent vapor was<br />
greater than 60 per cent.<br />
Fig. 6 shows the coefficients of Fig. 5 plotted against the average<br />
linear velocity, arbitrarily taken as the geometric mean of the<br />
calculated velocities entering and leaving that section, deleting<br />
the data shown by triangles and arrows in Fig. 5, and adding data<br />
for sections where vaporization started. If the curves of Fig. 5<br />
are compared, it will be found that, in the range of p from 55 to<br />
70 per cent, the coefficients are complicated functions of the feed<br />
F i g . 7 E f f e c t o f S t e a m P r e s s u r e a n d P e r C e n t V a p o r i z e d f o r<br />
B e n z e n e R u n s W i t h F e e d R a t e s R a n g i n g F r o m 6 1 5 t o 8 1 8 L b<br />
p e r H r ; C u r v e s f o r P o f 1 .6 F r o m F i g . 5